Using InfluxDB + Grafana to Display Network Statistics
I loathe MRTG graphs. They were cool in 2000, but now they’re showing their age. We have much better visualisation tools available, and we don’t need to be so aggressive with aggregating old data. I’ve been working with InfluxDB + Grafana recently. Much cooler, much more flexible. Here’s a walk-through on setting up InfluxDB + Grafana, collecting network throughput data, and displaying it.
influxsnmp is no longer updated, and the instructions below won’t work properly. Check out this new blog on how to use Telegraf with InfluxDB and Grafana instead.Background - InfluxDB + Grafana
There’s three parts to this:
- Grafana: This is our main UI. Grafana is a ”…graph and dashboard builder for visualizing time series metrics.” It makes it easy to create dashboards for displaying time-series data. It works with several different data sources such as Graphite, Elasticsearch, InfluxDB, and OpenTSDB.
- InfluxDB: This is where we store the data that Grafana displays. InfluxDB is “…an open-source distributed time series database with no external dependencies.” It’s a relatively new project, and is not quite at 1.0 yet, but it shows a lot of promise. It can be used in place of Graphite. It is very flexible, and can store events as well as time series data.
- Influxsnmp: We need to get data from the network into InfluxDB. There are a few options for doing this, but none of them are particularly good right now. Influxsnmp is a simple utility for collecting data via SNMP and storing it in InfluxDB.
You might ask why I’m using separate collection, persistent store and presentation layers, rather than using one system that does it all. The advantage of this model is that is much more flexible - I can easily add collectors to get data from different sources, or I can use other data stores that I already have. If I later decide I don’t like Grafana, I can query InfluxDB from something else.
Installation
All steps are taken on an Ubuntu 14.04 system. Steps may vary for other systems. Note also that I’m using the nightly builds for InfluxDB + Grafana, so expect to see the outputs change slightly in future.
InfluxDB
Download, install and start InfluxDB:
1
2
3
4
5
6
7
8
9
10
11
12
13
14
15
16
17
18
19
20
21
22
23
24
lhill@grafana:~$ curl -O https://s3.amazonaws.com/influxdb/influxdb_nightly_amd64.deb
  % Total    % Received % Xferd  Average Speed   Time    Time     Time  Current
                                 Dload  Upload   Total   Spent    Left  Speed
100 14.1M  100 14.1M    0     0   433k      0  0:00:33  0:00:33 --:--:--  416k
lhill@grafana:~$ sudo dpkg -i influxdb_nightly_amd64.deb
[sudo] password for lhill:
Selecting previously unselected package influxdb.
(Reading database ... 95702 files and directories currently installed.)
Preparing to unpack influxdb_nightly_amd64.deb ...
Unpacking influxdb (0.9.5-nightly-9633410) ...
Setting up influxdb (0.9.5-nightly-9633410) ...
 Removing any system startup links for /etc/init.d/influxdb ...
 Adding system startup for /etc/init.d/influxdb ...
   /etc/rc0.d/K20influxdb -> ../init.d/influxdb
   /etc/rc1.d/K20influxdb -> ../init.d/influxdb
   /etc/rc6.d/K20influxdb -> ../init.d/influxdb
   /etc/rc2.d/S20influxdb -> ../init.d/influxdb
   /etc/rc3.d/S20influxdb -> ../init.d/influxdb
   /etc/rc4.d/S20influxdb -> ../init.d/influxdb
   /etc/rc5.d/S20influxdb -> ../init.d/influxdb
lhill@grafana:~$ sudo service influxdb start
Starting the process influxdb [ OK ]
influxdb process was started [ OK ]
lhill@grafana:~$
Now use the InfluxDB CLI client to create two databases. We’re going to use one for SNMP data, and another for storing events. Note that we don’t need to declare schemas.
1
2
3
4
5
6
7
8
lhill@grafana:~$ /opt/influxdb/influx
Visit https://enterprise.influxdata.com to register for updates, InfluxDB server management, and monitoring.
Connected to http://localhost:8086 version 0.9.5-nightly-9633410
InfluxDB shell 0.9.5-nightly-9633410
> create database snmp
> create database events
> exit
lhill@grafana:~$
We now have InfluxDB running. You can connect to http://localhost:8083/ for a simple Web UI to InfluxDB, or query it with the CLI client.
Influxsnmp
Influxsnmp is written in Go. Today it is only distributed as source, so we need to build it. The build process includes some components that require Go >= v1.3. The default repositories for Ubuntu 14.04 have Go v1.2.1. So for this setup we’re going to download the latest Golang binary package, and use that.
First install git, then get Go 1.5.1, and setup our environment:
1
2
3
4
5
6
7
8
9
10
11
12
13
14
15
16
17
18
19
20
21
22
23
24
25
26
27
28
29
30
31
32
33
34
35
36
37
38
lhill@grafana:~$ sudo apt-get install git
Reading package lists... Done
Building dependency tree
Reading state information... Done
The following extra packages will be installed:
 git-man
Suggested packages:
 git-daemon-run git-daemon-sysvinit git-doc git-el git-email git-gui gitk
 gitweb git-arch git-bzr git-cvs git-mediawiki git-svn
The following NEW packages will be installed:
 git git-man
0 upgraded, 2 newly installed, 0 to remove and 0 not upgraded.
Need to get 3,325 kB of archives.
After this operation, 21.5 MB of additional disk space will be used.
Do you want to continue? [Y/n] Y
Get:1 http://nz.archive.ubuntu.com/ubuntu/ trusty-updates/main git-man all 1:1.9.1-1ubuntu0.1 [698 kB]
Get:2 http://nz.archive.ubuntu.com/ubuntu/ trusty-updates/main git amd64 1:1.9.1-1ubuntu0.1 [2,627 kB]
Fetched 3,325 kB in 2s (1,133 kB/s)
Selecting previously unselected package git-man.
(Reading database ... 95719 files and directories currently installed.)
Preparing to unpack .../git-man_1%3a1.9.1-1ubuntu0.1_all.deb ...
Unpacking git-man (1:1.9.1-1ubuntu0.1) ...
Selecting previously unselected package git.
Preparing to unpack .../git_1%3a1.9.1-1ubuntu0.1_amd64.deb ...
Unpacking git (1:1.9.1-1ubuntu0.1) ...
Processing triggers for man-db (2.6.7.1-1ubuntu1) ...
Setting up git-man (1:1.9.1-1ubuntu0.1) ...
Setting up git (1:1.9.1-1ubuntu0.1) ...
lhill@grafana:~$ curl -O https://storage.googleapis.com/golang/go1.5.1.linux-amd64.tar.gz
  % Total    % Received % Xferd  Average Speed   Time    Time     Time  Current
                                 Dload  Upload   Total   Spent    Left  Speed
100 74.2M 100 74.2M 0 0 1010k      0  0:01:15  0:01:15  --:--:-- 1126k
lhill@grafana:~$ tar zxf go1.5.1.linux-amd64.tar.gz
lhill@grafana:~$ echo 'export GOROOT=$HOME/go' >> .profile
lhill@grafana:~$ echo 'export PATH=$PATH:$GOROOT/bin' >> .profile
lhill@grafana:~$ echo 'export GOPATH=$HOME/work' >> .profile
lhill@grafana:~$ . .profile
lhill@grafana:~$
Now download the source for influxsnmp and build it:
1
2
3
4
5
6
lhill@grafana:~$ go get github.com/paulstuart/influxsnmp
lhill@grafana:~$ go install github.com/paulstuart/influxsnmp
lhill@grafana:~$ ls $GOPATH/bin/
influxsnmp
lhill@grafana:~$ cp $GOPATH/src/github.com/paulstuart/influxsnmp/oids.txt $GOPATH/bin/
lhill@grafana:~$ mkdir $GOPATH/etc
The packaging for influxsnmp isn’t quite right yet, so we have to manually copy over the oids.txt file. There are sample config.gcfg & ports.txt files that ship with influxsnmp. They’re easy to understand. Here’s what mine look like, for polling a few interfaces on my SRX. Note the location of ports.txt - it needs to be in the same directory as the binary file.
1
2
3
4
5
6
7
8
9
10
11
12
13
14
15
16
17
18
19
20
21
22
23
24
25
26
27
28
29
30
31
32
33
34
35
36
37
38
39
40
41
42
43
44
45
46
47
48
49
lhill@grafana:~$ cat $GOPATH/etc/config.gcfg
; multiple snmp devices can be specified
; their config name must match a mib config name
; or an alternate config name can be used
; or there must be a wildcard mib configured -- named '*'

[snmp "srx110"]
host = srx
community = Sup3rS3cr3t
port = 161
timeout = 20
retries = 5
repeat = 0
freq = 30
;debug = false
; if port file is ommited then all columns will be retrieved
portfile = ports.txt

; this is a wildcard -- becomes default
; if a 'snmp' section name is not otherwise specified
[mibs "*"]
name = ifXEntry
scalers = false
column = ifHCInOctets
column = ifHCInUcastPkts
column = ifHCOutOctets
column = ifHCOutUcastPkts
column = ifInErrors
column = ifInDiscards
column = ifOutErrors
column = ifOutDiscards

[influx "*"]
host = localhost
port = 8086
db = snmp
;user = username
;password = password

; web status monitor - set port to 0 to disable
[http]
port = 9501
lhill@grafana:~$ cat $GOPATH/bin/ports.txt
# snmp_column label_for_metrics
fe-0/0/4 NetBeez
fe-0/0/5 AppleTV
fe-0/0/6 Wireless
fe-0/0/7 TiVo
at-1/0/0 ADSL
Finally we’ll start the poller:
1
2
3
4
5
6
lhill@grafana:~$ nohup $GOPATH/bin/influxsnmp -config $GOPATH/etc/config.gcfg -logs $HOME/log > $HOME/log/nohup.out 2>&1 &
lhill@grafana:~$ cat log/nohup.out
nohup: ignoring input
Web interface:
http://192.168.166.164:9501
lhill@grafana:~$
(Yes, it really should be properly installed as a service, with proper config file locations, logging, etc.)
There’s a simple http interface listening on port 9501. That has some basic stats on influxsnmp operations. We can also take a look at InfluxDB to check that we’re receiving data:
1
2
3
4
5
6
7
8
9
10
11
12
13
14
15
16
17
> select value from ifHCInOctets where column='ADSL'
name: ifHCInOctets
------------------
time            value
1445821685851115439 52912945362
1445821692356103691 52912957099
1445821722367440151 52913306572
1445821752356421192 52914402662
1445821782357405741 52914782128
1445821812356691368 52914913911
1445821842357547023 52915284111
1445821872357314936 52915831952
1445821902357408200 52915932362
1445821932357485730 52915948310
1445821962356608706 52916072093

>
So far so good - we’re collecting data, storing it, and we can query it with InfluxDB. Now we need to create visualisations.
Grafana
First download, install & start Grafana. Note that I’m using a nightly build again.
1
2
3
4
5
6
7
8
9
10
11
12
13
14
15
16
17
18
19
20
21
22
lhill@grafana:~$ curl -O https://grafanarel.s3.amazonaws.com/builds/grafana_latest_amd64.deb
  % Total    % Received % Xferd  Average Speed   Time    Time     Time  Current
                                 Dload  Upload   Total   Spent    Left  Speed
100 22.0M  100 22.0M    0     0   568k      0  0:00:39  0:00:39 --:--:--  608k
lhill@grafana:~$ sudo dpkg -i grafana_latest_amd64.deb
Selecting previously unselected package grafana.
(Reading database ... 96458 files and directories currently installed.)
Preparing to unpack grafana_latest_amd64.deb ...
Unpacking grafana (2.5.0-pre1) ...
Setting up grafana (2.5.0-pre1) ...
Adding system user `grafana' (UID 105) ...
Adding new user `grafana' (UID 105) with group `grafana' ...
Not creating home directory `/usr/share/grafana'.
### NOT starting grafana-server by default on bootup, please execute
 sudo update-rc.d grafana-server defaults 95 10
### In order to start grafana-server, execute
 sudo service grafana-server start
Processing triggers for ureadahead (0.100.0-16) ...
ureadahead will be reprofiled on next reboot
lhill@grafana:~$ sudo service grafana-server start
 * Starting Grafana Server                                                                                                                             [ OK ]
lhill@grafana:~$
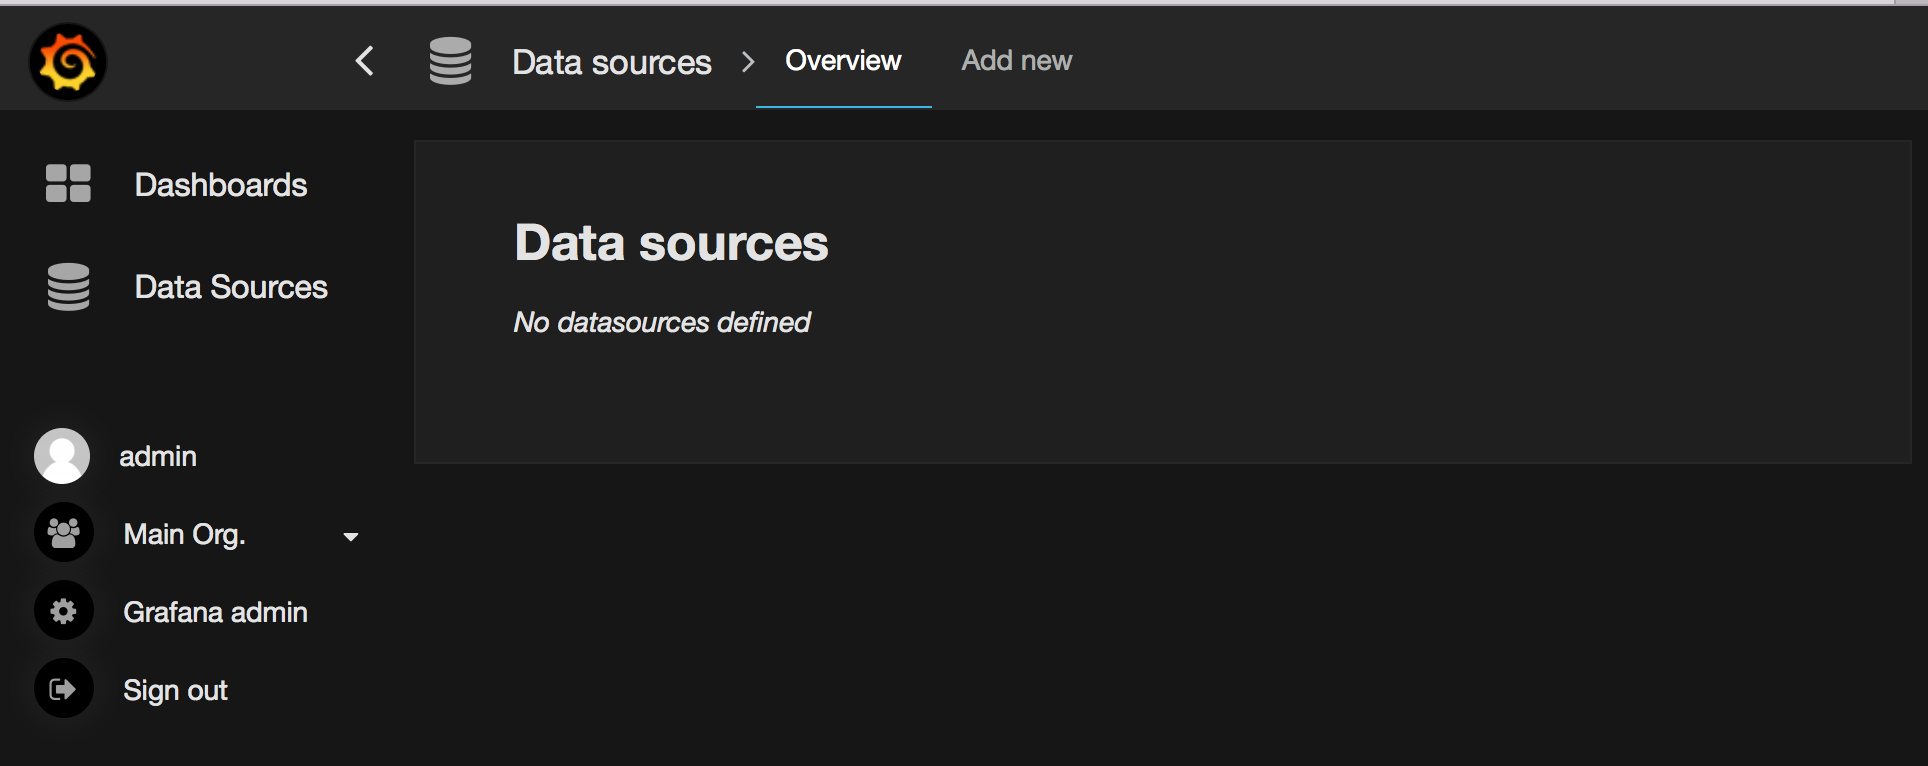
Grafana is now listening on port 3000. Open a web browser, and login using the default admin/admin. Click on Data Sources on the left:
Click Add new and fill in these details:
- Name: snmp
- Default: selected
- Type: InfluxDB 0.9.x
- Http settings: - Url
http://localhost:8086 - InfluxDB Details: - set Database to ‘snmp’. We’re not using a username & password, but you need to put something in there to be able to save this. So use admin/admin
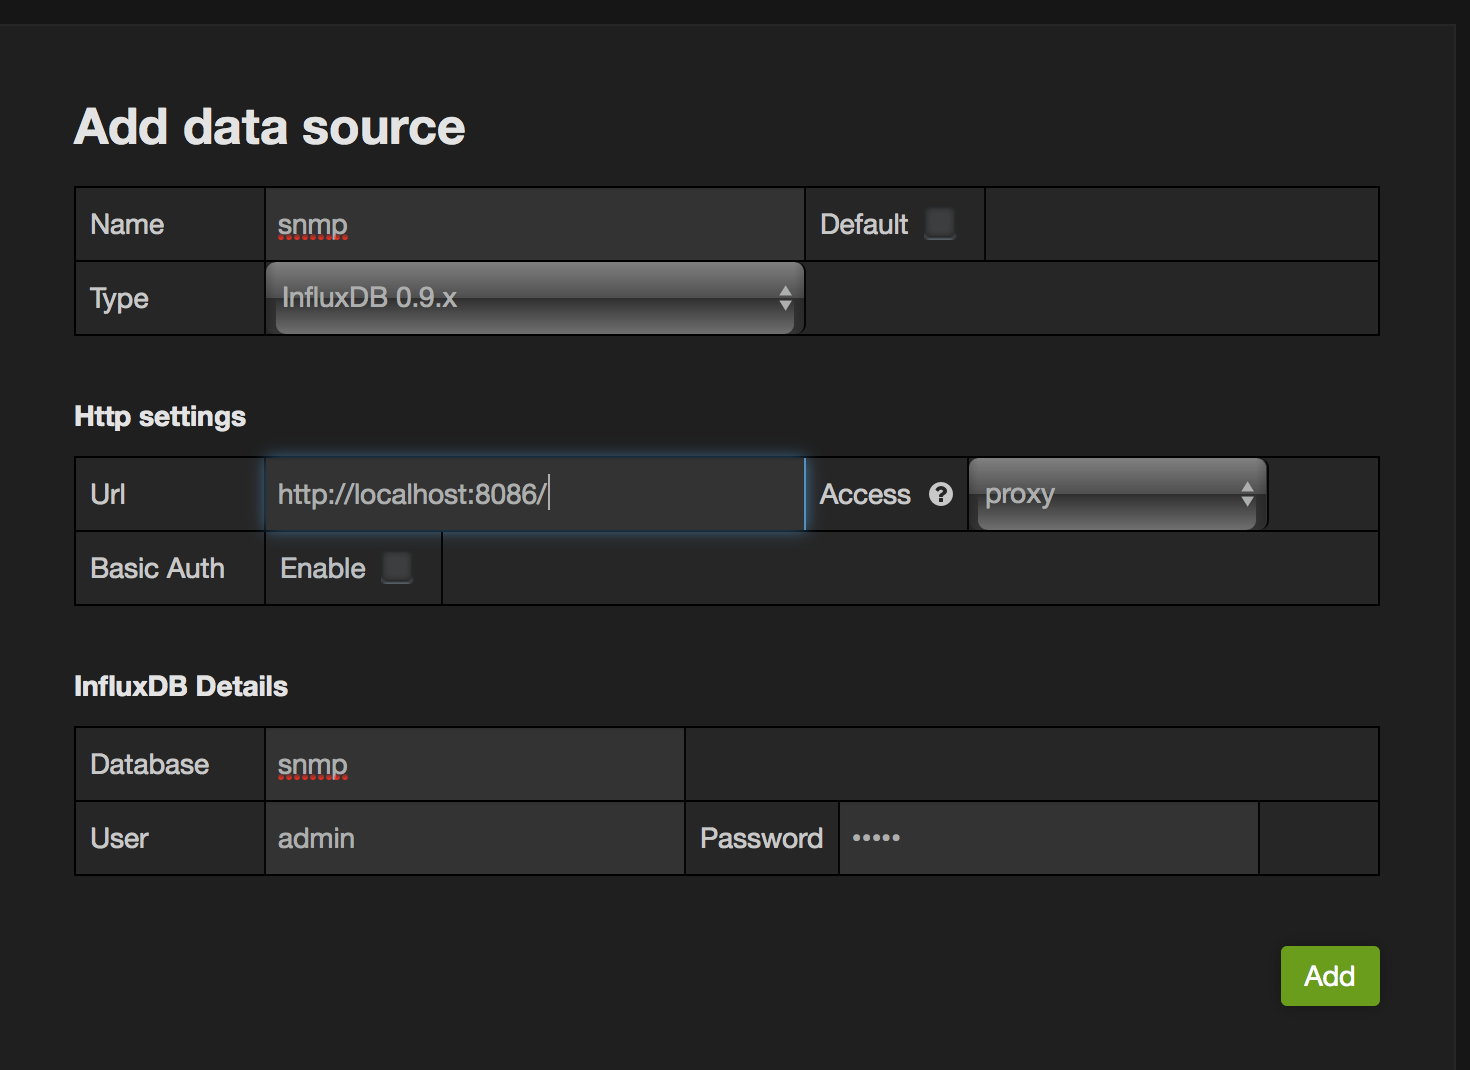
After you’ve clicked Add, you’ll be able to click Test Connection - try it, and make sure that it’s OK.
Repeat the above process for a new Data Source, with two differences - set the Database as “events” and leave “Default” unchecked. We’ll use this later for annotations.
Now we’re ready to go with creating dashboards.
Visualising the Data
Dashboards
Grafana lets you have multiple dashboards. Each dashboard is a set of panels, where a panel could be a graph, a single metric, or some text. You could have a dashboard with 10 separate graphs, or maybe just one huge number. We want to set up a simple dashboard that shows us a graph of the current traffic on my ADSL link.
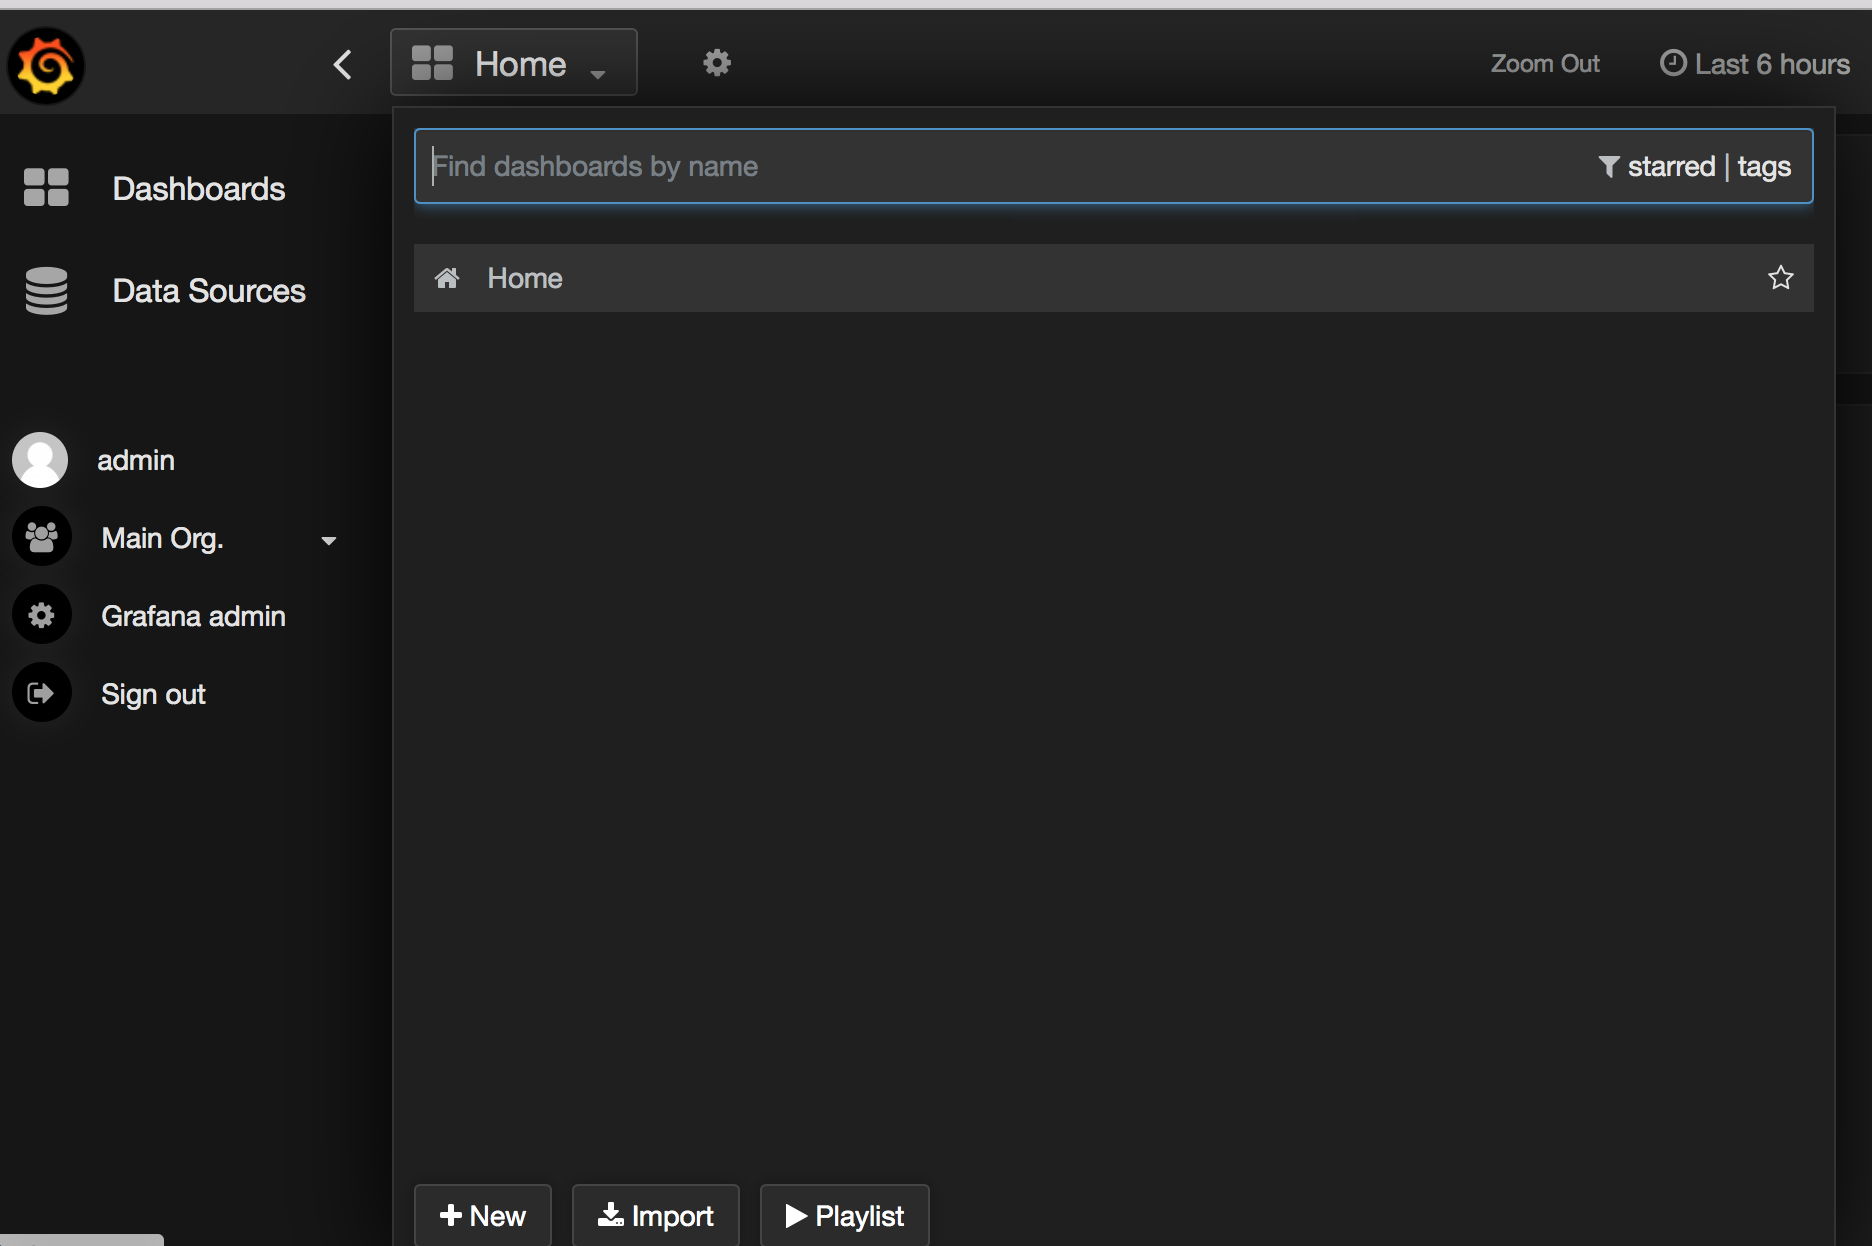
Click on Dashboards on the left, then the drop-down arrow beside Home. Click New at the bottom:
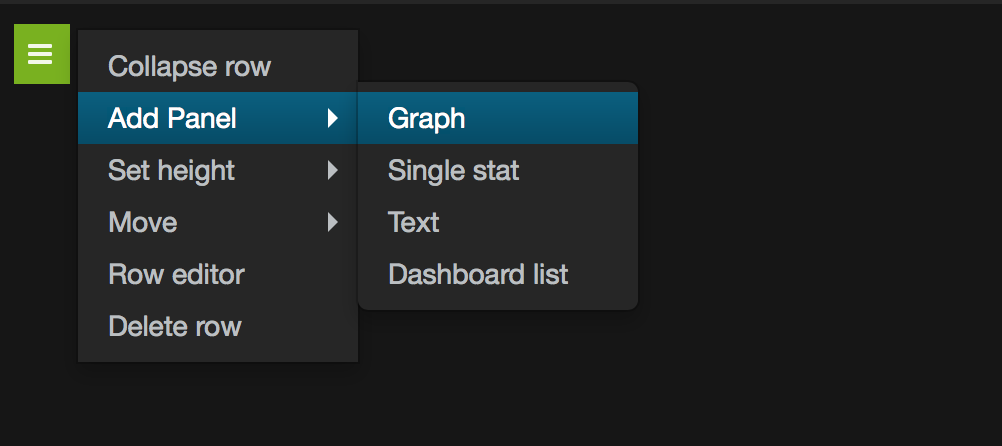
On the new blank dashboard, click the small bar at the top left. That will expand out. Choose Add Panel -> Graph
Now you’ll get a graph with test data. Click on the title, where it says “no title (click here).” On the pop-up box, click Edit.
Click on the General tab, and set the title to “ADSL Throughput.” Click on Metrics. Grafana’s query editor works well for regular measurements, but it doesn’t currently work for derivative functions. We’ll use the editor to build up our query, and then switch to raw mode to finish off.
Next to FROM, click “select measurement” - this will change to a drop-down that should list the different measurements we’re collecting. We want “ifHCInOctets.” On the WHERE _line, click +, select “column” = “ADSL” You’ll need to choose one of your own interfaces, as defined in ports.txt. On the _ALIAS BY line, enter “Input.”
Click the “+ Query” button, and add a new query with the same settings as above, except select “ifHCOutOctets.”
Now we need to edit the queries in ‘raw’ mode. Your query screen should look like this:
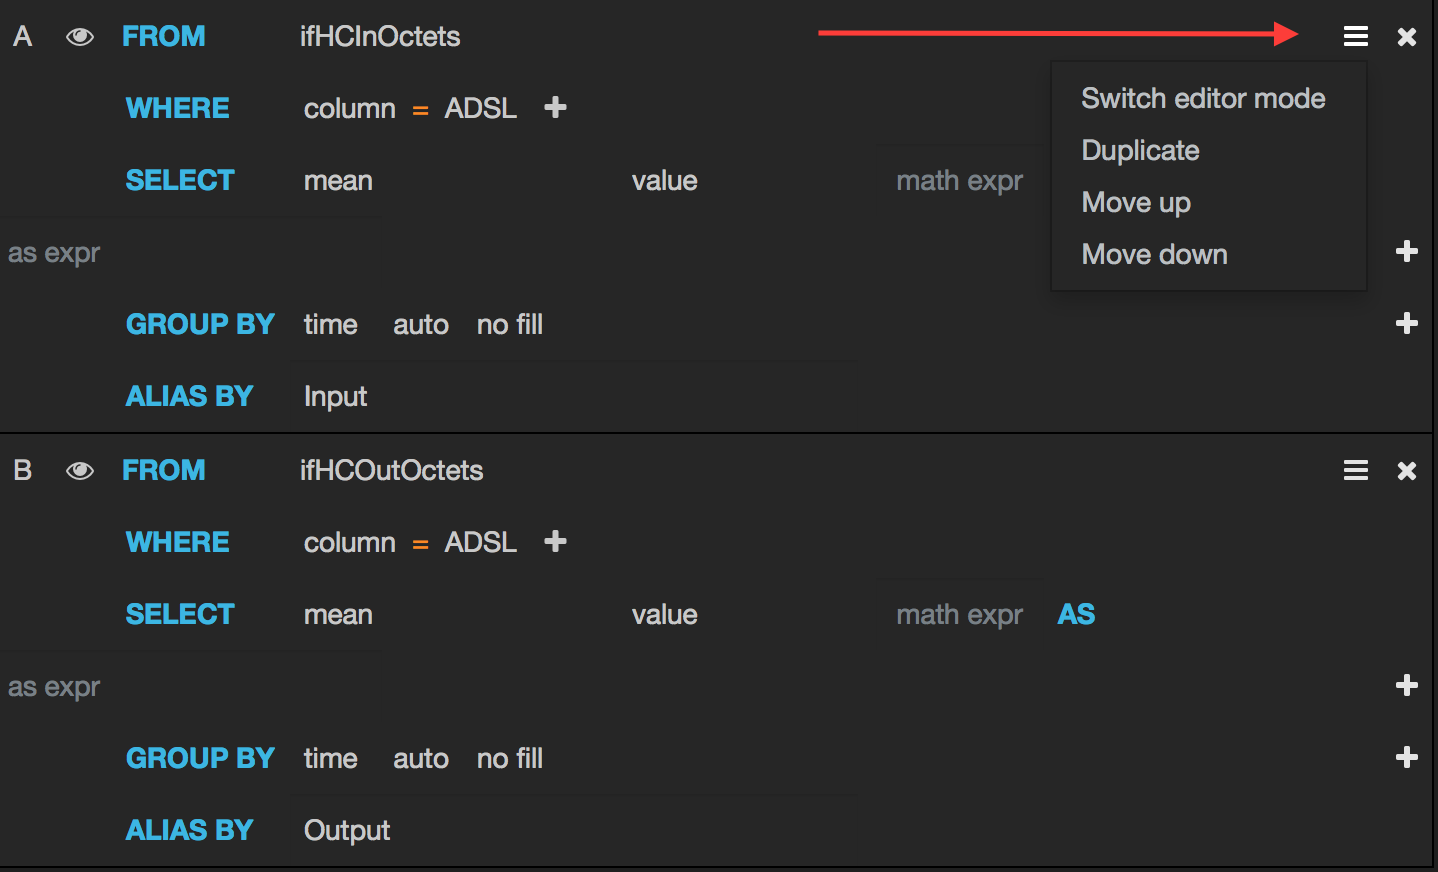
Click the menu button in the top left, and click “Switch editor mode.” We need to add the derivative() function, because we’re collecting a counter, not a rate. We also need to multiply the result by 8, to get bps. Your queries should look like this:
1
SELECT 8 * derivative(mean("value"),1s) AS "value" FROM "ifHCInOctets" WHERE "column" = 'ADSL' AND $timeFilter GROUP BY time($interval) fill(none)
One more thing to do - click on Axes & Grid and click “short” next to Unit. From the drop-down, go data rate -> bits/sec. If you like, you can also enable Legend values: Min, Max, Avg, Current.
Click Back to dashboard. Click on the Gear icon near the top centre of the screen, and choose Settings. Give the dashboard a title, and click the Save dashboard icon.
You should now have a screen that looks something like this:

Play around with the time picker in the top-left of the screen, and try selecting & zooming into a time window. It will get more interesting as you collect more data.
Templating
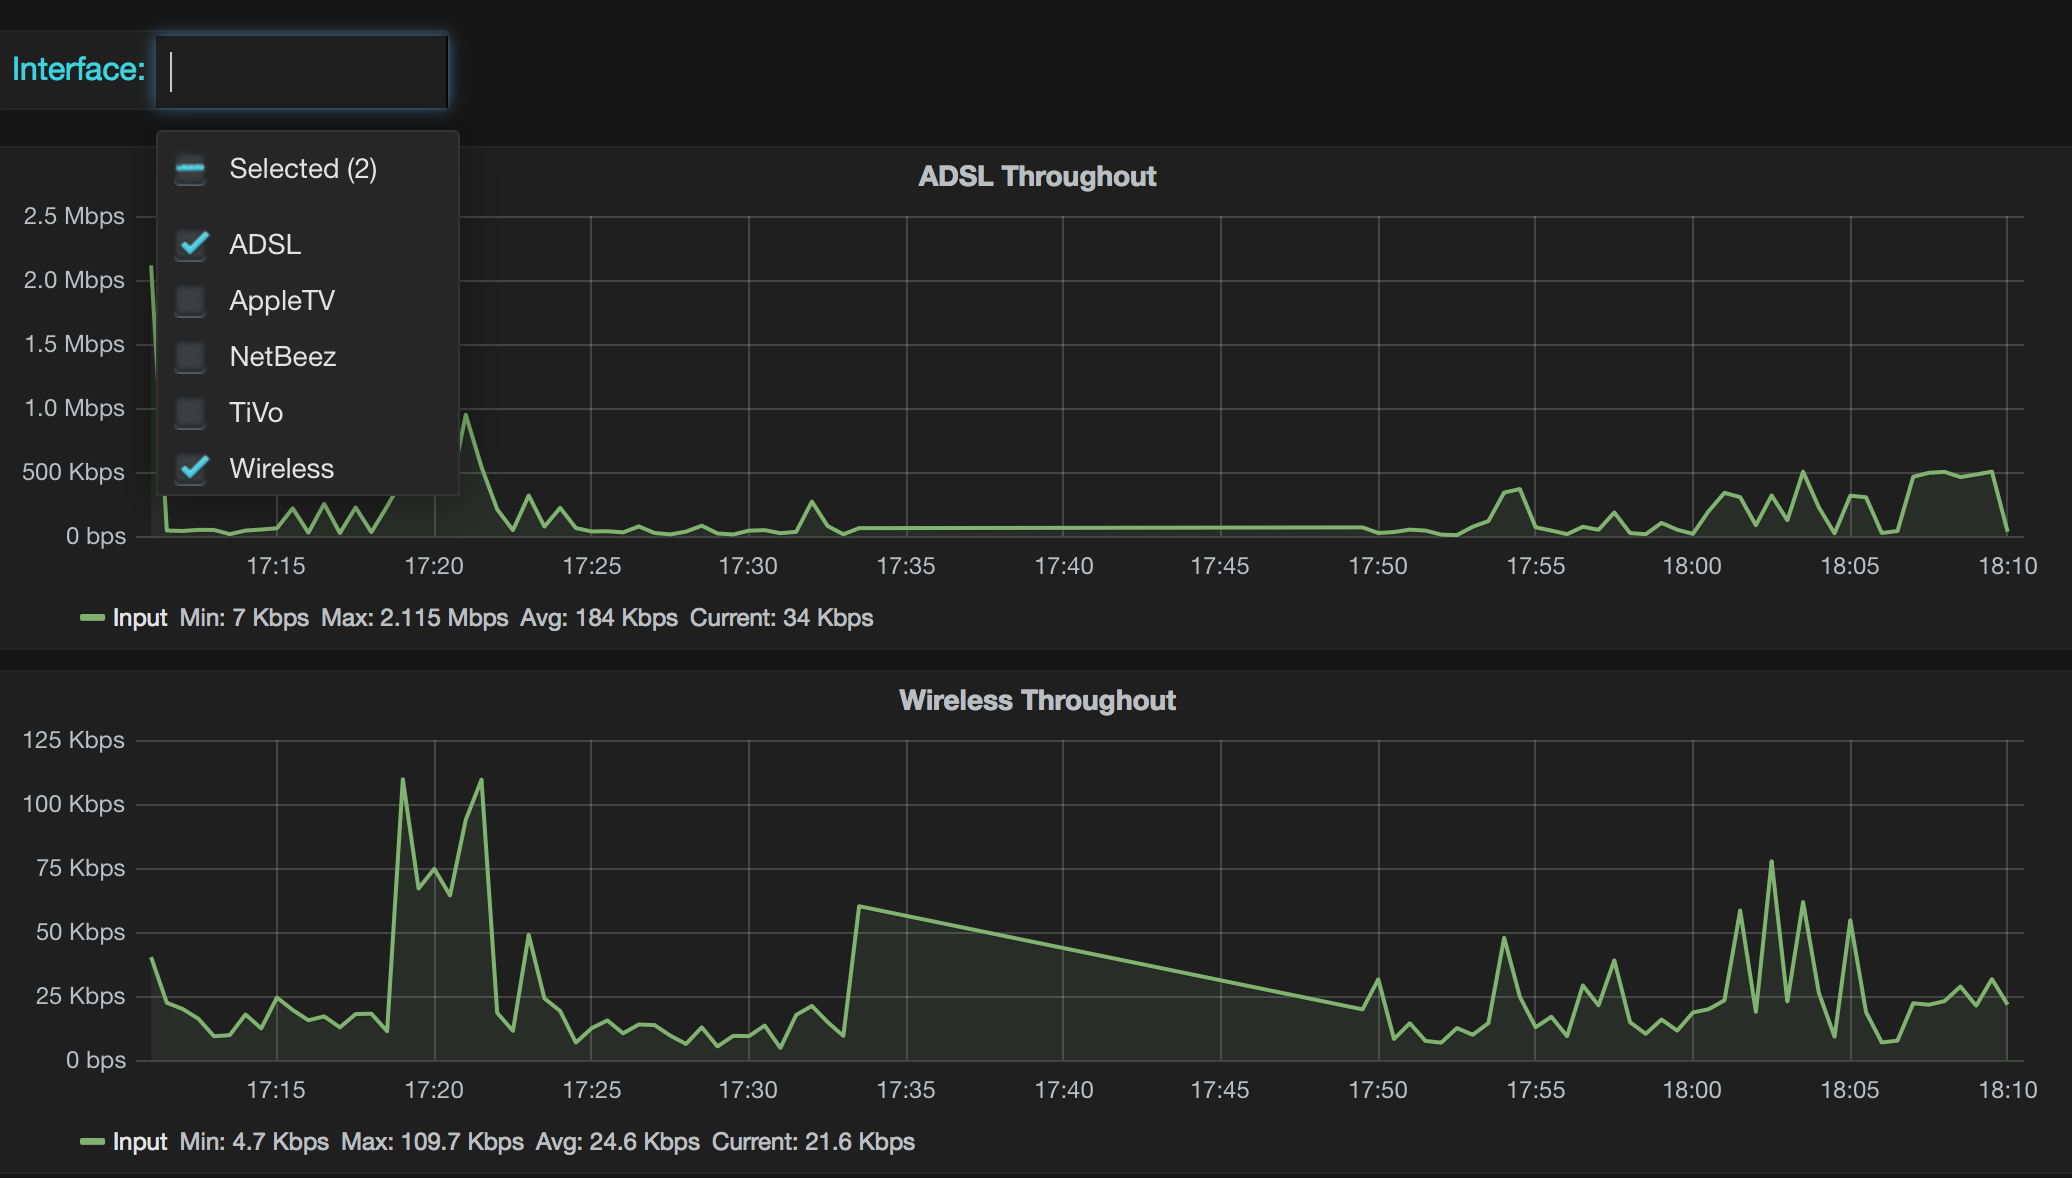
That graph is OK, but what about having a graph per interface? Or having a drop-down list of interfaces, so we can choose which ones get displayed? This is where the Grafana Template functionality is useful. Click on the Dashboard Gear icon, and click Templating. Click “+New”
Set Name: _Interface, leave it at _Type: query, Data Source: snmp. Set the Query _to SHOW TAG VALUES WITH KEY = "column" and enable Multi-value selection. Click _Add. Close the Templating box.
Edit the original graph. Change each query to that it looks for the variable “$Interface” instead of ‘ADSL.’ On the General tab, change the title to “$Interface Throughput.” Set Repeat Panel to “Interface.” Save the Dashboard.
There will be a drop-down list of Interfaces at the top of the Dashboard. Choose a different interface, and watch the graph update. Select two interfaces at once, and see how you get two graphs:
Annotations
One of the nice things about InfluxDB + Grafana is that it is easy to add events to a graph. These are called annotations. They could be anything - e.g. a link state change, or maybe a production code deployment notification. Here I’ve stored my events in InfluxDB, but you could pull them from somewhere else - e.g. Elasticsearch. Ideal if you have your syslogs going into an ELK stack.
For this example I want to add annotations when I start & stop watching a TV show on Netflix. This should show up in my traffic stats.
Go to Dashboard settings -> Annotations. Click “+New” and call it “Netflix.” Make sure the Datasource is set to “events.” The query should be: SELECT * FROM "alert" WHERE $timeFilter and for the Column mappings, set Title to “show”, and Text to “text.” Close the Annotations box.
Go to the CLI, and manually stuff in some events:
1
2
3
4
5
6
7
8
9
10
11
12
13
lhill@grafana:~$ curl -i -XPOST 'http://localhost:8086/write?db=events' --data-binary 'alert,host=srx,show=Spartacus text="Started watching Netflix" 1445475780000000000'
HTTP/1.1 204 No Content
Request-Id: 9d7642cc-7ba3-11e5-81d9-000000000000
X-Influxdb-Version: 0.9.5-nightly-9633410
Date: Mon, 26 Oct 2015 05:37:15 GMT

lhill@grafana:~$ curl -i -XPOST 'http://localhost:8086/write?db=events' --data-binary 'alert,host=srx,show=Spartacus text="Finished watching Netflix" 1445477318374301617'
HTTP/1.1 204 No Content
Request-Id: b6419d5f-7ba3-11e5-81de-000000000000
X-Influxdb-Version: 0.9.5-nightly-9633410
Date: Mon, 26 Oct 2015 05:37:57 GMT

lhill@grafana:~$
Now we get annotations on our graph. Hover over them, and the tool-tip displays some more info:

One small niggle is that you can’t disable annotations on a per-graph basis, only on a per-dashboard basis. Still, it’s very handy.
Future improvements
Obviously there’s a lot that could be improved upon here:
- Sort out the SNMP data capture - either package up influxsnmp properly, or (preferred answer): write a plugin for Telegraf.
- Write Ansible + Vagrant config to package up the above
- Even better: Do it with Docker, based upon Brent’s work.
- Add more network data sources - e.g. system-level stats, or NOS data collected via API.
The point is that it’s a flexible framework, and it doesn’t need to just be network stats. It gets much more interesting once you start adding in other data sources.
