Using Telegraf, InfluxDB and Grafana to Monitor Network Statistics
Two years ago I wrote about how to use InfluxDB & Grafana for better visualization of network statistics. I still loathe MRTG graphs, but configuring InfluxSNMP was a bit of a pain. Luckily it’s now much easier to collect SNMP data using Telegraf. InfluxDB and Grafana have also improved a lot. Read on for details about to monitor network interface statistics using Telegraf, InfluxDB and Grafana.
Background - Telegraf, InfluxDB + Grafana
There’s three parts to this:
-
Grafana: Grafana is “The open platform for beautiful analytics and monitoring.” It makes it easy to create dashboards for displaying data from many sources, particularly time-series data. It works with several different data sources such as Graphite, Elasticsearch, InfluxDB, and OpenTSDB. We’re going to use this as our main front end for visualizing our network statistics.
-
InfluxDB: InfluxDB is “…a data store for any use case involving large amounts of timestamped data.” This is where we’re going to store our network statistics. It is designed for exactly this use-case, where metrics are collected over time.
-
Telegraf: Telegraf is “…a plugin-driven server agent for collecting and reporting metrics.” This can collect data from a wide variety of sources, e.g. system statistics, API calls, DB queries, and SNMP. It can then send those metrics to a variety of datastores, e.g. Graphite, OpenTSDB, Datadog, Librato. Telegraf is maintained by InfluxData, the people behind InfluxDB. So it has very good support for writing data to InfluxDB.
You might ask why I’m using separate collection, storage and presentation layers, rather than using one system that does it all. The advantage of this model is that is much more flexible - I can easily add collectors to get data from different sources, or I can query different data stores from my visualization layer. Maybe I can even mash up multiple data sources in one graph or dashboard. If I later decide I don’t like Grafana, I can switch to something else, e.g. Chronograf, a user interface written by InfluxData.
Installation
My base system is a minimal install of Ubuntu 16.04 LTS, with all updates applied. I use Vagrant I’m using stable versions of Telegraf, InfluxDB and Grafana. No need for nightly or custom builds anymore!
To give us something to monitor, I have an Extreme VDX 6740 switch in my lab. We’ll use that as a target device.
InfluxDB
Follow the standard installation instructions to add the Influx Data repo, then install and start InfluxDB v1.3:
1
2
3
4
5
6
7
8
9
10
11
12
13
14
15
16
17
18
19
20
21
22
23
24
25
26
27
28
29
30
31
32
33
34
35
36
37
38
39
40
41
42
ubuntu@telegraf:~$ curl -sL https://repos.influxdata.com/influxdb.key | sudo apt-key add -
OK
ubuntu@telegraf:~$ source /etc/lsb-release
ubuntu@telegraf:~$ echo "deb https://repos.influxdata.com/${DISTRIB_ID,,} ${DISTRIB_CODENAME} stable" | sudo tee /etc/apt/sources.list.d/influxdb.list
deb https://repos.influxdata.com/ubuntu xenial stable
ubuntu@telegraf:~$ sudo apt update && sudo apt install influxdb
Hit:1 https://repos.influxdata.com/ubuntu xenial InRelease
Hit:2 http://archive.ubuntu.com/ubuntu xenial InRelease
Get:3 http://security.ubuntu.com/ubuntu xenial-security InRelease [102 kB]
Get:13 http://security.ubuntu.com/ubuntu xenial-security/universe amd64 Packages [183 kB]
Get:14 http://archive.ubuntu.com/ubuntu xenial-updates/main Translation-en [279 kB]
Get:15 http://security.ubuntu.com/ubuntu xenial-security/universe Translation-en [96.5 kB]
Get:16 http://archive.ubuntu.com/ubuntu xenial-updates/universe amd64 Packages [555 kB]
Get:17 http://archive.ubuntu.com/ubuntu xenial-updates/universe Translation-en [226 kB]
Get:18 http://archive.ubuntu.com/ubuntu xenial-backports/universe Sources [4,940 B]
Get:19 http://archive.ubuntu.com/ubuntu xenial-backports/universe amd64 Packages [6,600 B]
Get:20 http://archive.ubuntu.com/ubuntu xenial-backports/universe Translation-en [3,760 B]
Fetched 3,511 kB in 14s (238 kB/s)
Reading package lists... Done
Building dependency tree
Reading state information... Done
1 package can be upgraded. Run 'apt list --upgradable' to see it.
Reading package lists... Done
Building dependency tree
Reading state information... Done
The following NEW packages will be installed:
  influxdb
0 upgraded, 1 newly installed, 0 to remove and 1 not upgraded.
Need to get 18.8 MB of archives.
After this operation, 58.9 MB of additional disk space will be used.
Get:1 https://repos.influxdata.com/ubuntu xenial/stable amd64 influxdb amd64 1.3.7-1 [18.8 MB]
Fetched 18.8 MB in 14s (1,293 kB/s)
Selecting previously unselected package influxdb.
(Reading database ... 86052 files and directories currently installed.)
Preparing to unpack .../influxdb_1.3.7-1_amd64.deb ...
Unpacking influxdb (1.3.7-1) ...
Processing triggers for man-db (2.7.5-1) ...
Setting up influxdb (1.3.7-1) ...
Created symlink from /etc/systemd/system/influxd.service to /lib/systemd/system/influxdb.service.
Created symlink from /etc/systemd/system/multi-user.target.wants/influxdb.service to /lib/systemd/system/influxdb.service.
ubuntu@telegraf:~$ sudo systemctl start influxdb
ubuntu@telegraf:~$
The defaults work for us, so we don’t need to make any changes to InfluxDB configuration.
Telegraf
We’re going to use the stable Telegraf packages. These are distributed from the same Influx Data repos we added in the last step. We just need to install & start Telegraf:
1
2
3
4
5
6
7
8
9
10
11
12
13
14
15
16
17
18
19
ubuntu@telegraf:~$ sudo apt install telegraf
Reading package lists... Done
Building dependency tree
Reading state information... Done
The following NEW packages will be installed:
  telegraf
0 upgraded, 1 newly installed, 0 to remove and 1 not upgraded.
Need to get 8,771 kB of archives.
After this operation, 26.4 MB of additional disk space will be used.
Get:1 https://repos.influxdata.com/ubuntu xenial/stable amd64 telegraf amd64 1.4.4-1 [8,771 kB]
Fetched 8,771 kB in 7s (1,212 kB/s)
Selecting previously unselected package telegraf.
(Reading database ... 86078 files and directories currently installed.)
Preparing to unpack .../telegraf_1.4.4-1_amd64.deb ...
Unpacking telegraf (1.4.4-1) ...
Setting up telegraf (1.4.4-1) ...
Created symlink from /etc/systemd/system/multi-user.target.wants/telegraf.service to /lib/systemd/system/telegraf.service.
ubuntu@telegraf:~$ sudo systemctl start telegraf
ubuntu@telegraf:~$
This includes the right packaging bits such that Telegraf is now properly configured as a service. Much simpler than having to build Influxsnmp.
Now we just need to configure it to poll our switch. Before we do that, let’s install some SNMP utilities, so we can test our switch SNMP configuration:
1
2
3
4
5
6
7
8
9
10
11
12
13
14
15
16
17
18
19
20
21
22
23
24
25
26
27
28
29
30
31
ubuntu@telegraf:~$ sudo apt install snmp snmp-mibs-downloader
Reading package lists... Done
Building dependency tree
Reading state information... Done
Suggested packages:
  unzip
The following NEW packages will be installed:
  snmp snmp-mibs-downloader
0 upgraded, 2 newly installed, 0 to remove and 1 not upgraded.
Need to get 5,118 kB/5,273 kB of archives.
After this operation, 6,435 kB of additional disk space will be used.
Get:1 http://archive.ubuntu.com/ubuntu xenial/multiverse amd64 snmp-mibs-downloader all 1.1 [5,118 kB]
Fetched 5,118 kB in 13s (382 kB/s)
Selecting previously unselected package snmp.
(Reading database ... 86021 files and directories currently installed.)
Preparing to unpack .../snmp_5.7.3+dfsg-1ubuntu4_amd64.deb ...
Unpacking snmp (5.7.3+dfsg-1ubuntu4) ...
Selecting previously unselected package snmp-mibs-downloader.
Preparing to unpack .../snmp-mibs-downloader_1.1_all.deb ...
Unpacking snmp-mibs-downloader (1.1) ...
Processing triggers for man-db (2.7.5-1) ...
Setting up snmp (5.7.3+dfsg-1ubuntu4) ...
Setting up snmp-mibs-downloader (1.1) ...
<snip>
ubuntu@telegraf:~$ sudo vi /etc/snmp/snmp.conf
ubuntu@telegraf:~$ cat /etc/snmp/snmp.conf
# As the snmp packages come without MIB files due to license reasons, loading
# of MIBs is disabled by default. If you added the MIBs you can reenable
# loading them by commenting out the following line.
# mibs :
ubuntu@telegraf:~$
Note that last step there - I commented out the mibs: line in snmp.conf.
My switch already has SNMP configured, but let’s quickly check it is behaving:
1
2
3
4
5
6
7
8
9
ubuntu@telegraf:~$ snmpwalk -v 2c -c public 10.26.7.223 system
SNMPv2-MIB::sysDescr.0 = STRING: Brocade VDX Switch, BR-VDX6740, Network Operating System Software Version 7.1.0.
SNMPv2-MIB::sysObjectID.0 = OID: SNMPv2-SMI::enterprises.1588.3.3.1.131
DISMAN-EVENT-MIB::sysUpTimeInstance = Timeticks: (934278900) 108 days, 3:13:09.00
SNMPv2-MIB::sysContact.0 = STRING: Field Support.
SNMPv2-MIB::sysName.0 = STRING: LEAF1
SNMPv2-MIB::sysLocation.0 = STRING: TME lab
SNMPv2-MIB::sysServices.0 = INTEGER: 79
ubuntu@telegraf:~$
OK, looking good.
Now we need to configure Telegraf to poll our switch. Configuration is stored at /etc/telegraf/telegraf.conf. It will also read in any configuration files in /etc/telegraf/telegraf.d, as long as the filename ends with .conf.
The default telegraf.conf file tells it to monitor various system level metrics (disk, CPU, memory, processes, etc), and write it to InfluxDB, in the telegraf database. We can leave all that at default - it will work for our purposes. We just need to add some configuration to tell it to use SNMP to poll our switch.
We’re going to take the example configuration from here, and tweak it a little bit. By default, Telegraf polls metrics every 10s. That can be a bit aggressive when polling network devices via SNMP, so we’re going to adjust that a little.
Here’s what our configuration file looks like:
1
2
3
4
5
6
7
8
9
10
11
12
13
14
15
16
17
18
19
20
21
22
23
24
25
26
27
28
29
30
31
32
33
34
35
36
37
38
39
40
41
42
43
44
45
46
47
48
49
50
51
52
53
54
ubuntu@telegraf:~$ cat /etc/telegraf/telegraf.d/leaf1.conf
[[inputs.snmp]]
  agents = [ "10.26.7.223" ]
  version = 2
  community = "public"
  interval = "60s"
  timeout = "10s"
  retries = 3

  [[inputs.snmp.field]]
    name = "hostname"
    oid = "RFC1213-MIB::sysName.0"
    is_tag = true

  [[inputs.snmp.field]]
    name = "uptime"
    oid = "DISMAN-EXPRESSION-MIB::sysUpTimeInstance"

  # IF-MIB::ifTable contains counters on input and output traffic as well as errors and discards.
  [[inputs.snmp.table]]
    name = "interface"
    inherit_tags = [ "hostname" ]
    oid = "IF-MIB::ifTable"

    # Interface tag - used to identify interface in metrics database
    [[inputs.snmp.table.field]]
      name = "ifDescr"
      oid = "IF-MIB::ifDescr"
      is_tag = true

  # IF-MIB::ifXTable contains newer High Capacity (HC) counters that do not overflow as fast for a few of the ifTable counters
  [[inputs.snmp.table]]
    name = "interface"
    inherit_tags = [ "hostname" ]
    oid = "IF-MIB::ifXTable"

    # Interface tag - used to identify interface in metrics database
    [[inputs.snmp.table.field]]
      name = "ifDescr"
      oid = "IF-MIB::ifDescr"
      is_tag = true

  # EtherLike-MIB::dot3StatsTable contains detailed ethernet-level information about what kind of errors have been logged on an interface (such as FCS error, frame too long, etc)
  [[inputs.snmp.table]]
    name = "interface"
    inherit_tags = [ "hostname" ]
    oid = "EtherLike-MIB::dot3StatsTable"

    # Interface tag - used to identify interface in metrics database
    [[inputs.snmp.table.field]]
      name = "ifDescr"
      oid = "IF-MIB::ifDescr"
      is_tag = true
ubuntu@telegraf:~$
You can use the --test option to get Telegraf to grab one cycle of metrics, and publish them to stdout. This tells you that your configuration is sane, and capable of collecting data:
1
2
3
4
5
6
7
8
ubuntu@telegraf:~$ telegraf --test --config /etc/telegraf/telegraf.d/leaf1.conf
* Plugin: inputs.snmp, Collection 1
* Internal: 1m0s
> snmp,hostname=LEAF1,agent_host=10.26.7.223,host=telegraf uptime=934357700i 1511590281000000000
> interface,ifIndex=201424896,hostname=LEAF1,agent_host=10.26.7.223,host=telegraf,ifDescr=TenGigabitEthernet\ 34/0/12 ifPhysAddress="00:27:f8:c7:74:0b",ifOperStatus=2i,ifInOctets=0i,ifInUcastPkts=0i,ifInDiscards=0i,ifOutErrors=0i,ifOutQLen=0i,ifSpeed=0i,ifSpecific=".0.0",ifInNUcastPkts=0i,ifOutOctets=0i,ifAdminStatus=1i,ifLastChange=3300i,ifInErrors=0i,ifOutUcastPkts=0i,ifOutNUcastPkts=0i,ifType=6i,ifMtu=2500i,ifInUnknownProtos=0i,ifOutDiscards=0i,ifDescr="TenGigabitEthernet 34/0/12" 1511590285000000000
> interface,agent_host=10.26.7.223,host=telegraf,ifDescr=TenGigabitEthernet\ 34/0/22,ifIndex=201506816,hostname=LEAF1 ifOutQLen=0i,ifDescr="TenGigabitEthernet 34/0/22",ifMtu=2500i,ifOutUcastPkts=0i,ifInUcastPkts=0i,ifInNUcastPkts=0i,ifSpecific=".0.0",ifSpeed=0i,ifOperStatus=2i,ifInOctets=0i,ifOutOctets=0i,ifOutDiscards=0i,ifType=6i,ifAdminStatus=1i,ifLastChange=3300i,ifInUnknownProtos=0i,ifOutNUcastPkts=0i,ifOutErrors=0i,ifPhysAddress="00:27:f8:c7:74:15",ifInDiscards=0i,ifInErrors=0i 1511590285000000000
> interface,ifDescr=TenGigabitEthernet\ 34/0/15,ifIndex=201449472,hostname=LEAF1,agent_host=10.26.7.223,host=telegraf ifAdminStatus=1i,ifSpecific=".0.0",ifDescr="TenGigabitEthernet 34/0/15",ifSpeed=0i,ifLastChange=3300i,ifOutUcastPkts=0i,ifOutNUcastPkts=0i,ifPhysAddress="00:27:f8:c7:74:0e",ifOperStatus=2i,ifInUnknownProtos=0i,ifOutOctets=0i,ifOutQLen=0i,ifMtu=2500i,ifInOctets=0i,ifInNUcastPkts=0i,ifInDiscards=0i,ifInErrors=0i,ifOutDiscards=0i,ifOutErrors=0i,ifType=6i,ifInUcastPkts=0i 1511590285000000000
<snip>
This may produce a lot of output, if your device has many interfaces.
Now we just need to tell Telegraf to pick up the new configuration:
1
ubuntu@telegraf:/etc/telegraf$ sudo systemctl reload telegraf
That will now begin collecting data and storing it in InfluxDB.
After a couple of minutes, check to see if InfluxDB is storing results:
1
2
3
4
5
6
7
8
9
10
11
12
13
14
15
16
17
18
19
20
21
22
23
24
25
26
27
ubuntu@telegraf:~$ influx
Connected to http://localhost:8086 version 1.3.7
InfluxDB shell version: 1.3.7
> use telegraf
Using database telegraf
> show measurements
name: measurements
name
----
cpu
disk
diskio
interface
kernel
mem
processes
snmp
swap
system
> select * from interface limit 2
name: interface
time                agent_host  host   hostname ifAdminStatus ifAlias ifConnectorPresent ifDescr                    ifDescr_1                  ifHCInBroadcastPkts ifHCInMulticastPkts ifHCInOctets ifHCInUcastPkts ifHCOutBroadcastPkts ifHCOutMulticastPkts ifHCOutOctets ifHCOutUcastPkts ifHighSpeed ifInBroadcastPkts ifInDiscards ifInErrors ifInMulticastPkts ifInNUcastPkts ifInOctets ifInUcastPkts ifInUnknownProtos ifIndex   ifLastChange ifLinkUpDownTrapEnable ifMtu ifName ifOperStatus ifOutBroadcastPkts ifOutDiscards ifOutErrors ifOutMulticastPkts ifOutNUcastPkts ifOutOctets ifOutQLen ifOutUcastPkts ifPhysAddress     ifPromiscuousMode ifSpecific ifSpeed ifType
----                ----------  ----   -------- ------------- ------- ------------------ -------                    ---------                  ------------------- ------------------- ------------ --------------- -------------------- -------------------- ------------- ---------------- ----------- ----------------- ------------ ---------- ----------------- -------------- ---------- ------------- ----------------- -------   ------------ ---------------------- ----- ------ ------------ ------------------ ------------- ----------- ------------------ --------------- ----------- --------- -------------- -------------     ----------------- ---------- ------- ------
1511389515000000000 10.26.7.223 telegraf LEAF1    1                                        TenGigabitEthernet 34/0/31 TenGigabitEthernet 34/0/31                                                                                                                                                                             0            0                            0              0          0             0                 201580544 3300                                2500         2                               0             0                              0               0           0         0              00:27:f8:c7:74:1e                   .0.0       0       6
1511389515000000000 10.26.7.223 telegraf LEAF1    1                                        TenGigabitEthernet 34/0/17 TenGigabitEthernet 34/0/17                                                                                                                                                                             0            0                            0              0          0             0                 201465856 3300                                2500         2                               0             0                              0               0           0         0              00:27:f8:c7:74:10                   .0.0       0       6
> exit
ubuntu@telegraf:~$
Next step: installing and configuring Grafana, our visualization tool.
Grafana
Follow the standard installation instructions to add the Grafana repo and signing key, then install the package:
1
2
3
4
5
6
7
8
9
10
11
12
13
14
15
16
17
18
19
20
21
22
23
24
25
26
27
28
29
30
31
ubuntu@telegraf:/etc/telegraf$ echo "deb https://packagecloud.io/grafana/stable/debian/ jessie main" | sudo tee /etc/apt/sources.list.d/grafana.list
deb https://packagecloud.io/grafana/stable/debian/ jessie main
ubuntu@telegraf:/etc/telegraf$ curl https://packagecloud.io/gpg.key | sudo apt-key add -
  % Total    % Received % Xferd  Average Speed   Time    Time     Time  Current
                                 Dload  Upload   Total   Spent    Left  Speed
ubuntu@telegraf:/etc/telegraf$ sudo apt install grafana
Reading package lists... Done
Building dependency tree
Reading state information... Done
The following NEW packages will be installed:
  grafana
0 upgraded, 1 newly installed, 0 to remove and 1 not upgraded.
Need to get 47.3 MB of archives.
After this operation, 139 MB of additional disk space will be used.
Get:1 https://packagecloud.io/grafana/stable/debian jessie/main amd64 grafana amd64 4.6.2 [47.3 MB]
Fetched 47.3 MB in 37s (1,247 kB/s)
Selecting previously unselected package grafana.
(Reading database ... 86498 files and directories currently installed.)
Preparing to unpack .../grafana_4.6.2_amd64.deb ...
Unpacking grafana (4.6.2) ...
Processing triggers for systemd (229-4ubuntu21) ...
Processing triggers for ureadahead (0.100.0-19) ...
Setting up grafana (4.6.2) ...
### NOT starting on installation, please execute the following statements to configure grafana to start automatically using systemd
 sudo /bin/systemctl daemon-reload
 sudo /bin/systemctl enable grafana-server
### You can start grafana-server by executing
 sudo /bin/systemctl start grafana-server
Processing triggers for systemd (229-4ubuntu21) ...
Processing triggers for ureadahead (0.100.0-19) ...
ubuntu@telegraf:/etc/telegraf$
Note the comments there - Grafana does not auto-start. Let’s set it up to auto-start, and start it now:
1
2
3
4
5
6
7
ubuntu@telegraf:/etc/telegraf$ sudo systemctl daemon-reload
ubuntu@telegraf:/etc/telegraf$ sudo systemctl enable grafana-server
Synchronizing state of grafana-server.service with SysV init with /lib/systemd/systemd-sysv-install...
Executing /lib/systemd/systemd-sysv-install enable grafana-server
Created symlink from /etc/systemd/system/multi-user.target.wants/grafana-server.service to /usr/lib/systemd/system/grafana-server.service.
ubuntu@telegraf:/etc/telegraf$ sudo systemctl start grafana-server
ubuntu@telegraf:/etc/telegraf$
Grafana is now listening on port 3000. Open a web browser, go to http://{VM_IP}:3000/ and login using the default username/password combo: admin/admin.

Click on Add data source:
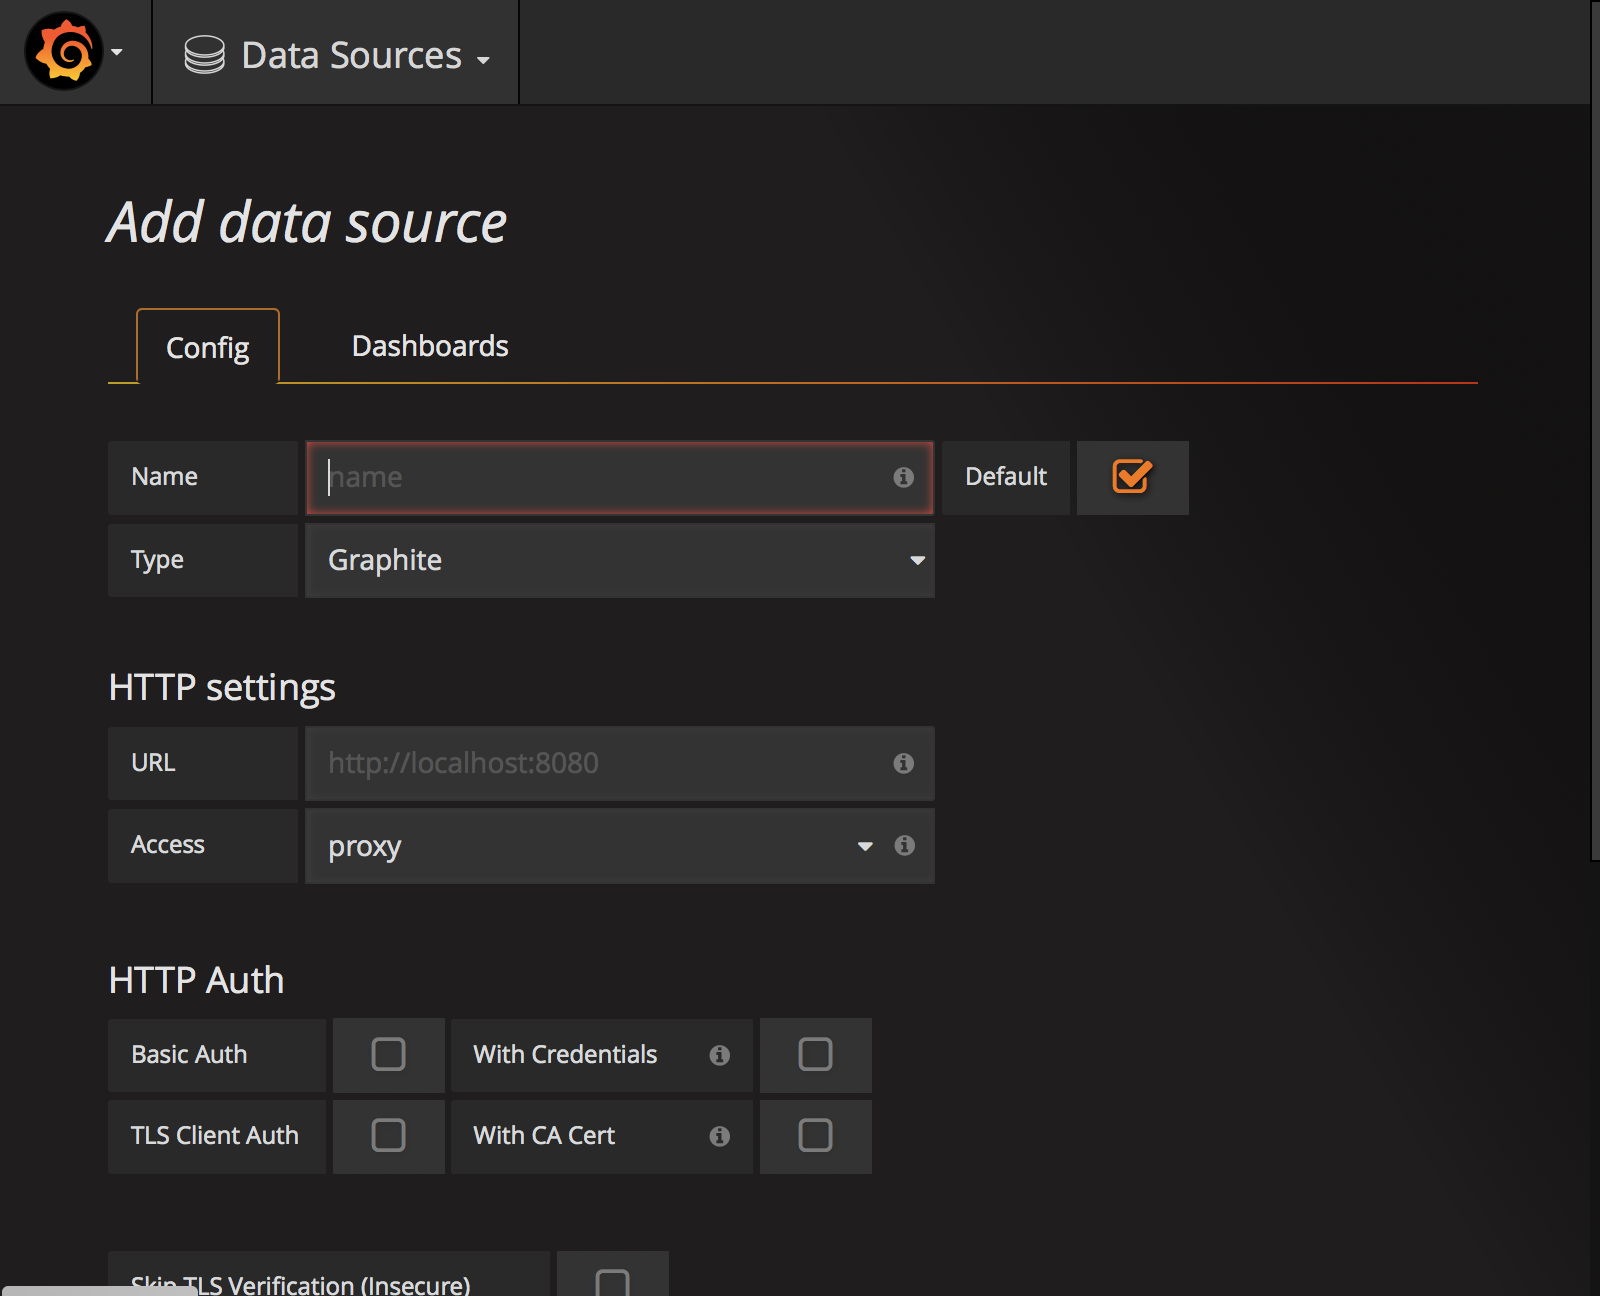
Fill in these details:
-
Name: telegraf
-
Default: selected
-
Type: InfluxDB
-
HTTP settings: URL
http://localhost:8086, Access: proxy -
InfluxDB Details: Set Database to ‘telegraf’. No username/password.
Add that, and you should see “Data source is working”:

So, to recap:
- We’ve installed InfluxDB to store our collected metrics.
- We’ve configured Telegraf to collect data via SNMP, and store it in InfluxDB.
- We’ve checked that Telegraf is getting data and that it is stored in InfluxDB.
- We’ve installed Grafana, and configured it to query InfluxDB.
Next steps: pulling it all together to create some graphs!
Visualising the Data
Grafana has the concept of “Dashboards” and “Panels.” A panel displays some set of metrics or values, using a variety of visualizations - e.g. a line graph, bar chart, single value, traffic light, etc. A dashboard is a set of panels, grouped however you like - e.g. you could have three horizontal panels all the same size, or maybe mix and match different sized-panels.
It is super easy to create new dashboards, add panels, and play around with different ways of presenting your data. The great thing is that the data doesn’t all need to be from the same source. You can easily combine different data sources, creating all kinds of useful visualizations.
We’ll set up a simple dashboard showing interface throughput, and we’ll add another panel to display system uptime.
Interface Throughput
Click on the Grafana icon in the top left, and go to Dashboards -> Home. Click on New dashboard:
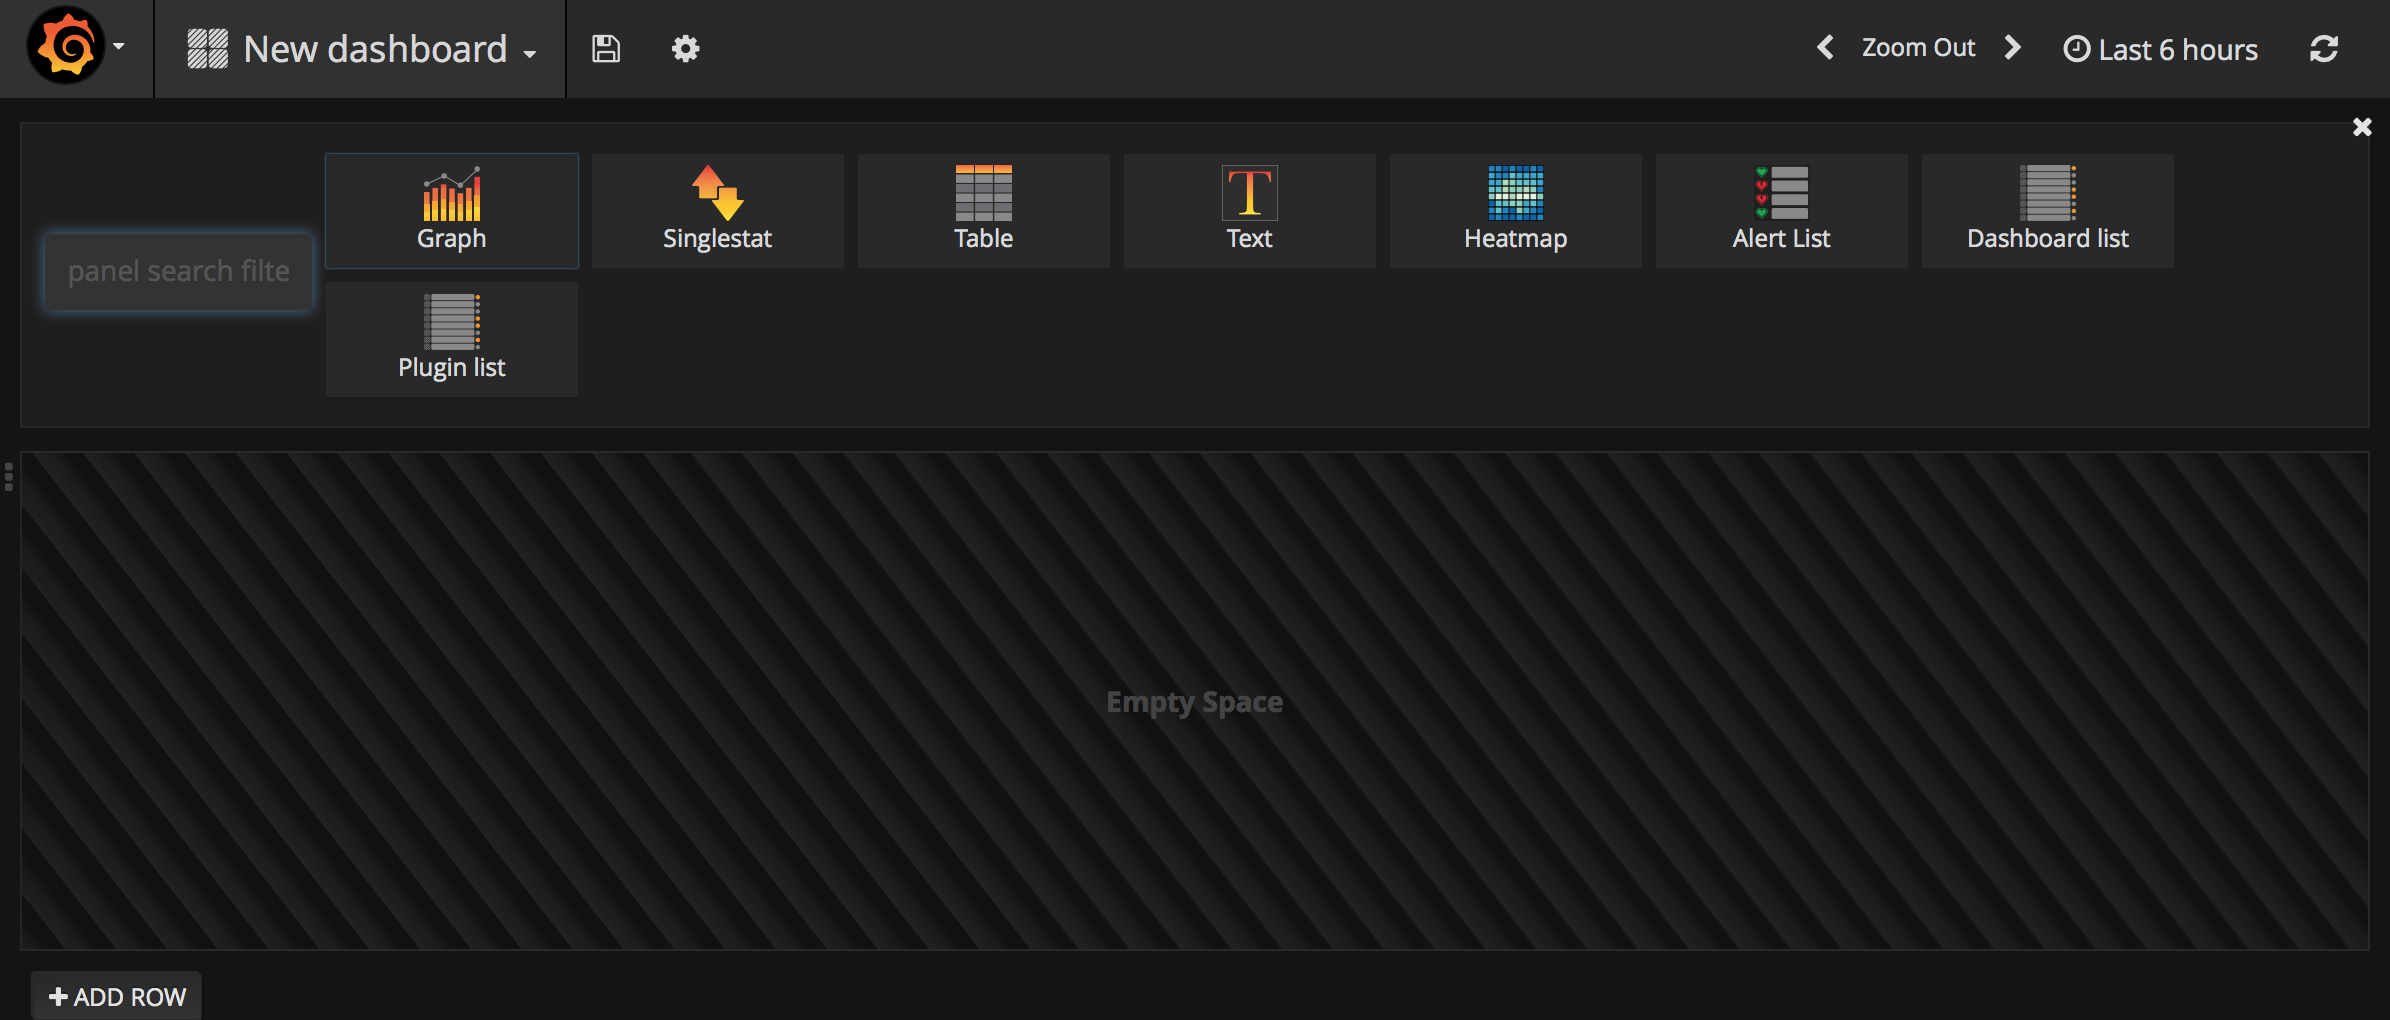
Click on Graph, then click on Panel Title on the new panel. Click Edit. Now we can add metrics, and set up our graph the way we want.
On the General tab, give it a title. Configure the Metrics tab like this:
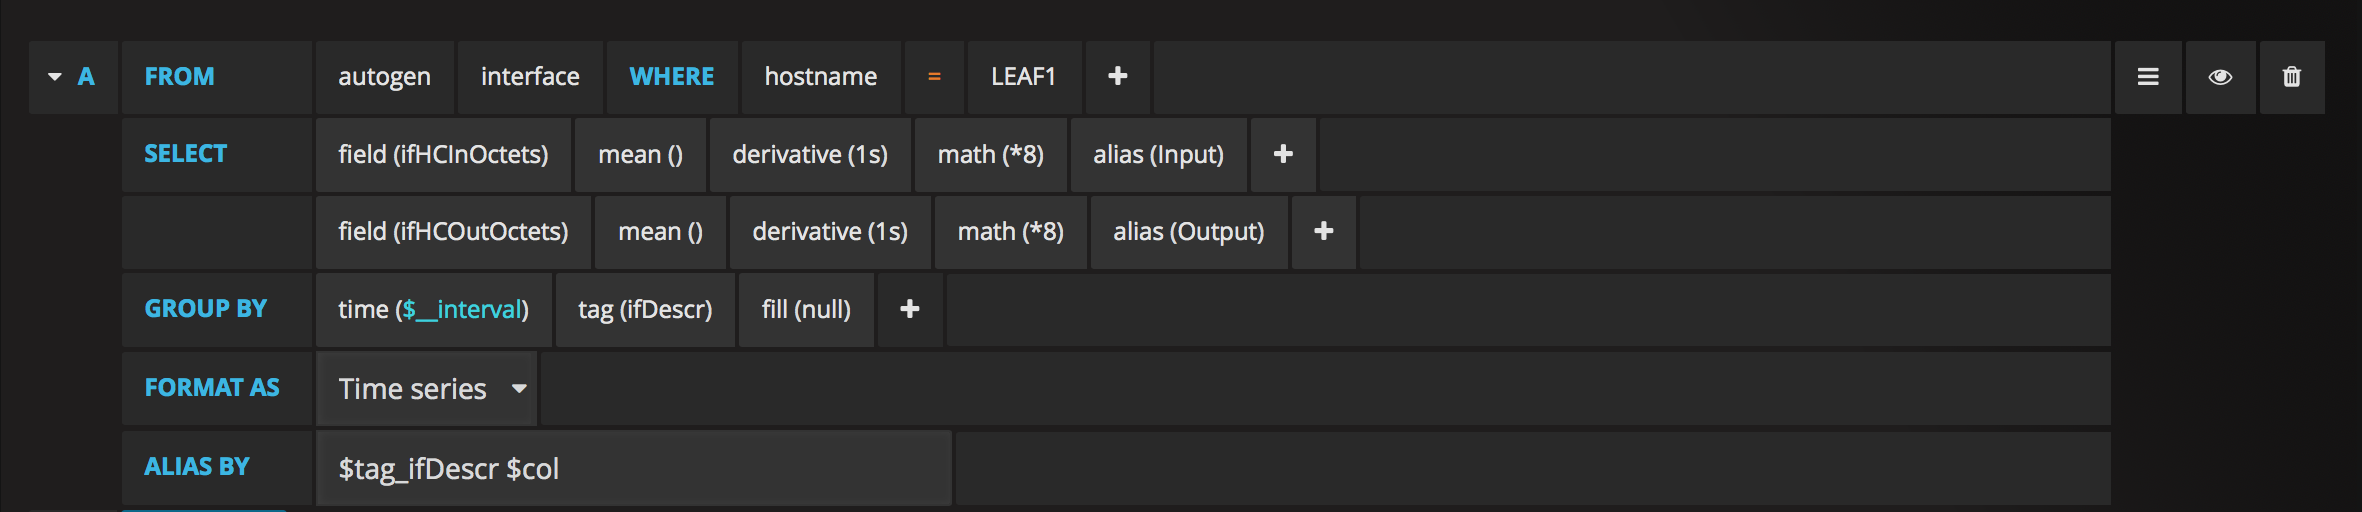
Key points:
- Use the ifHC* fields - for modern high-speed interfaces these are a better choice than the older ifInOctets/ifOutOctets.
- Note the use of
derivative(1s). The underlying data is stored as a counter that increments with every 8 bits received. This is not particularly useful on its own. By usingderivative(), combined withmath(*8), we can calculate bits per second. - My switch hostname is
LEAF1- you will need to use a differentWHERE hostname =filter. - We’ve grouped by time and
tag(ifDescr)- this splits the data out into separate lines per interface. - The ALIAS BY setting controls the labels given to each series. In this case it makes it show up as something like TenGigabitEthernet 34/0/1 Input.
On the Axes tab, set the Left Y Unit to data rate -> bits/sec.
On the Legend tab, select the With only zeros option. I only have a few interfaces enabled on this switch, so this will suppress display of all the disconnected interfaces.
All going well, you should now see a graph showing interface throughput:
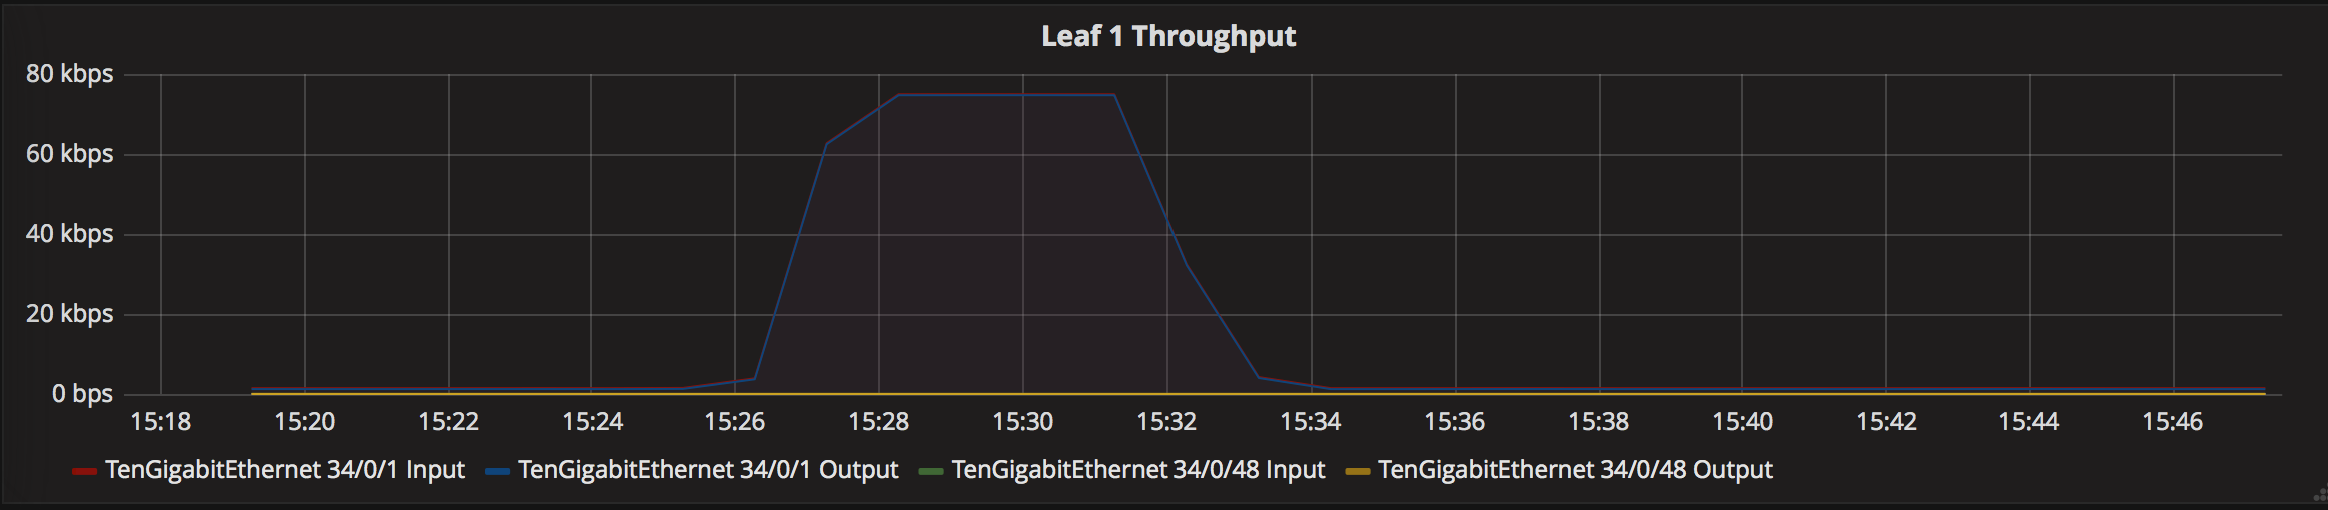
Play around with the time picker in the top-right of the screen, and try selecting & zooming into a time window. It will get more interesting as you collect more data.
Save your Dashboard by clicking the Save icon in the menu bar.
System Uptime
Let’s add a simple switch uptime display, to show how to use the single-stat display, with thresholding.
Add a Row to the Dashboard, and choose Singlestat. Edit it, and set the Title to “Uptime.”
Set the Metrics tab like this:
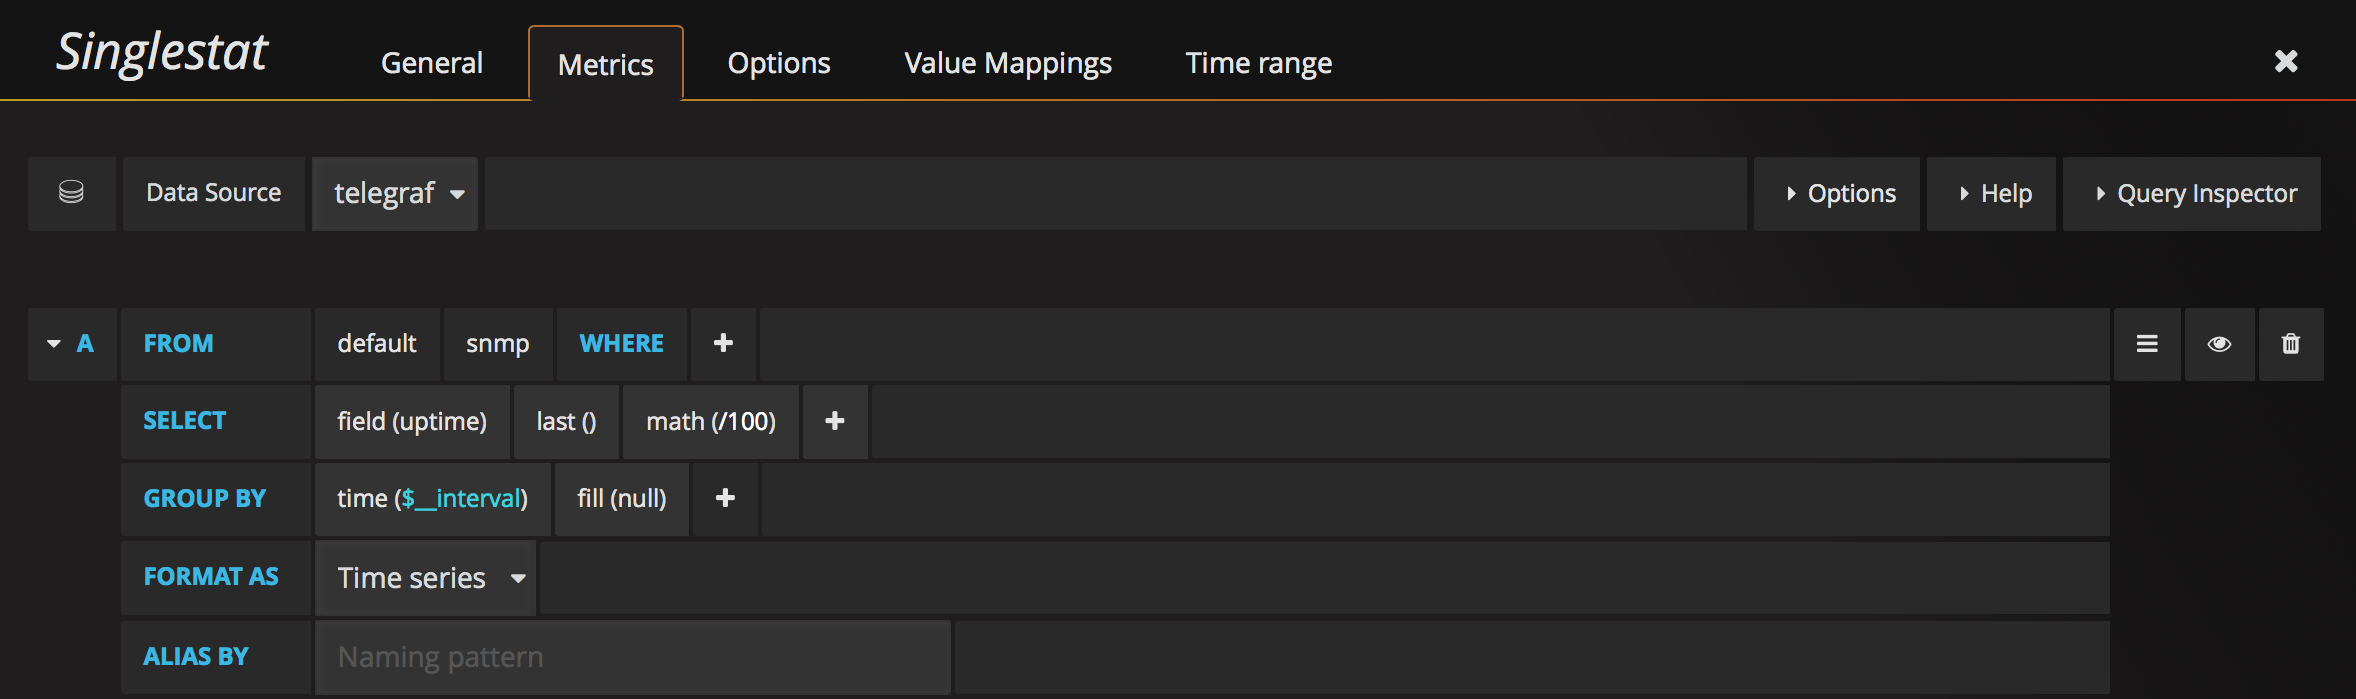
Note the use of math(/100) there. We’re converting the measured sysUptime value from hundredths of seconds to seconds.
Set the Options tab like this:
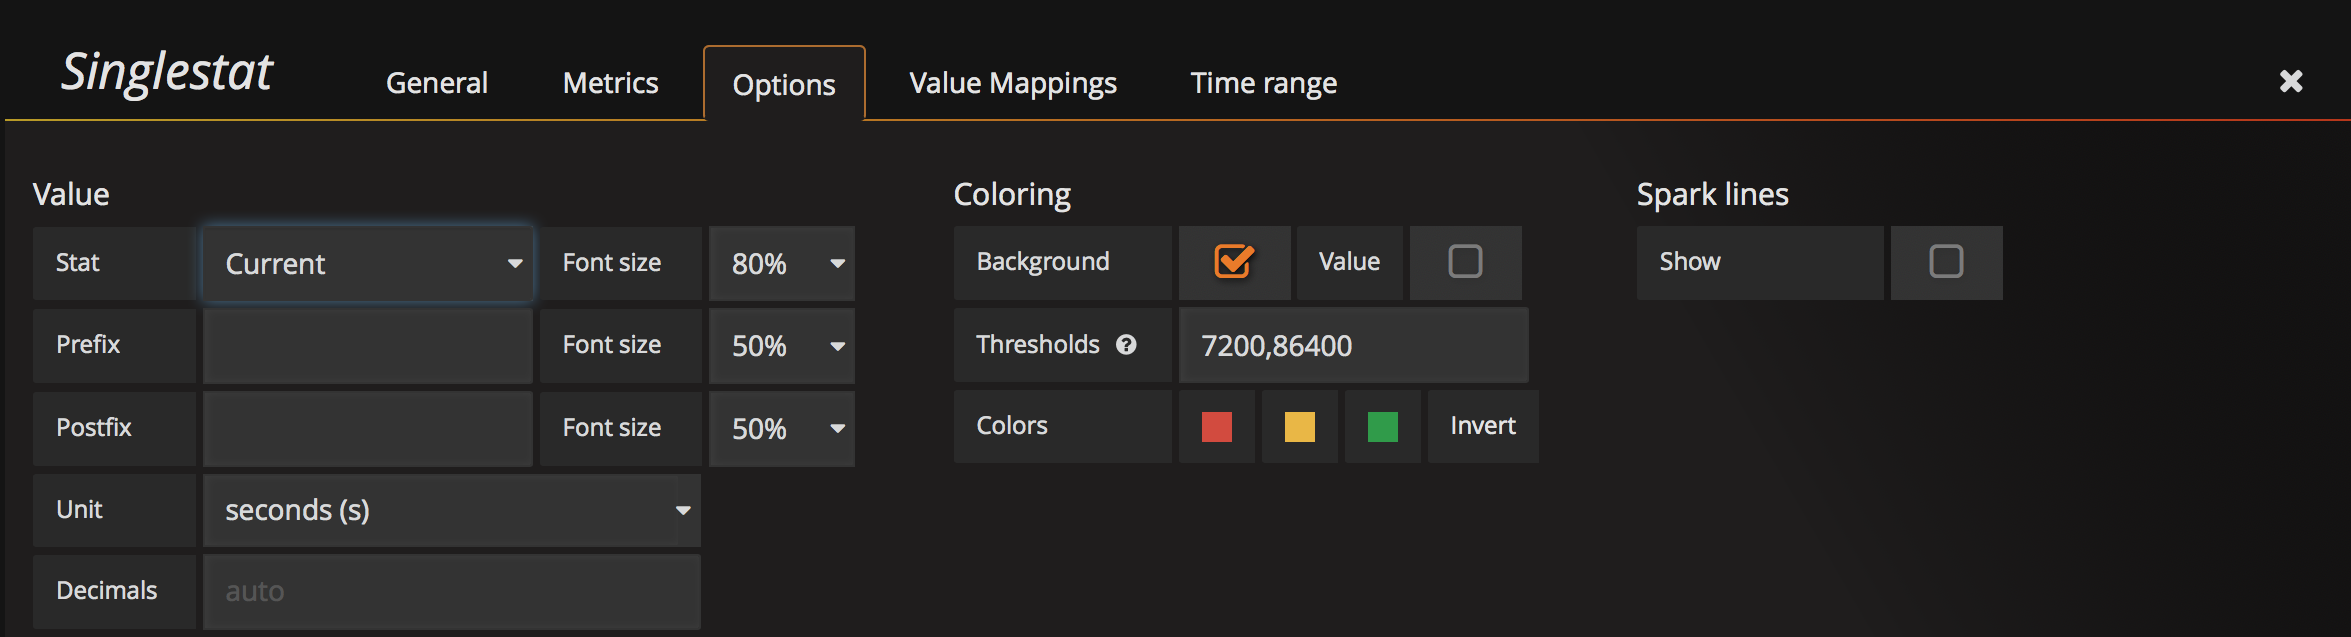
Couple of key points there:
- We’re using the Current Stat - this is the most recently received value.
- I’ve set the threshold to
7200,86400, and selected the “Background” option. This will change the background color between red/yellow/green if our switch was rebooted in the last 2 or 24 hours.
I’ve also clicked “Invert”, which switches Red & Green. We want to know if our switch was rebooted recently. Lower numbers are bad in this case.
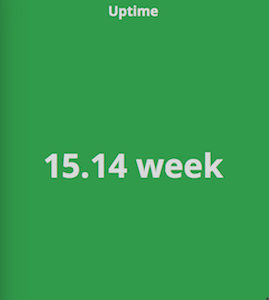
Set the unit to seconds (s), and you should get a panel that looks like this:
If the switch is rebooted, the background will change color. You can test what this looks like by playing around with the threshold values.
Future improvements
Obviously there’s a lot that could be improved upon here:
- Add templating to enable selection of specific interfaces, or repeating graphs per interface.
- Write Ansible + Vagrant config to package up the above.
- Even better: Do it with Docker, based upon Brent’s work.
- Add more network data sources - e.g. system-level stats, or NOS data collected via API.
- Add events (e.g. BGP peer status change, application code deploy) as annotations.
- Add alerting.
The point is that it’s a flexible framework, and it doesn’t need to just be network stats. It gets much more interesting once you start adding other data sources.