SNMP Counters - Collection Interval Variation
Counter data types are commonly used in SNMP monitoring. They are extremely useful, but there’s a couple of caveats around how to use them. Here’s a couple of issues I’ve come across:
What are Counters?
From RFC 2578:
The Counter32 type represents a non-negative integer which monotonically increases until it reaches a maximum value of 2^32-1 (4294967295 decimal), when it wraps around and starts increasing again from zero. Counters have no defined “initial” value, and thus, a single value of a Counter has (in general) no information content.
This is in contrast to data structures such as a Gauge32 value, which does return information with a single value - e.g. disk space utilised.
Counters are often used for interface statistics - e.g. ifInOctets, ifOutOctets, etc. When you need to work out the current utilisation on an interface, you can’t directly poll that rate - instead you poll the interface Counter at fixed intervals, and calculate the delta. That is then divided by the collection interval, to calculate the rate.
So you might poll the ifInOctets value for an interface, and get 10,000 octets at t=0. 300s later, you poll it again, and get 40,000 octects. From that, we can calculate the interface transmission rate as 800bps. 8*(40,000-10,000)/300. We can choose how frequently we want to poll the interface, and control how granular our data is.
Note that we also have 64-bit counters for some values, to handle high-speed interfaces, where a 32-bit integer might wrap within a collection cycle.
NMS Design Implications
When we collect Gauge-type information, we only need to worry about the specific value collected. But for Counters, we need to worry about both the current value and the last one (so we can calculate the delta), and we need to note the collection interval.
Here’s the wrinkle: which collection interval do I mean - the configured interval - e.g. 5 minutes - or the actual interval? The problem is that monitored systems cannot be guaranteed to always respond at exactly the same time delta. SNMP is usually a lower priority process, so if a system is busy, it might take an extra second to respond to an SNMP request. Now our collection intervals might look like 300s, 302s, 299s, 298s, 303s, 301s…Does that really matter? Can’t I just assume it is 300s? No!
Real-World Problems (1)
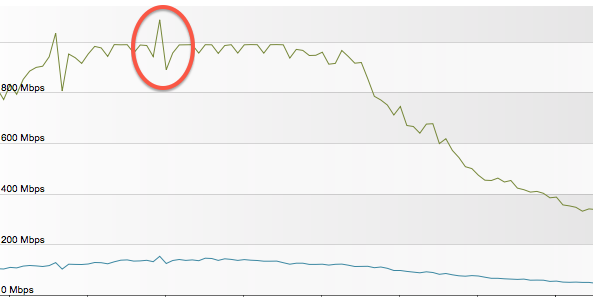
One of the NMS products I work with assumes that the collection interval is always the same. This leads to alerts like “Interface is reporting utilisation above 100%”, and graphs like this - in particular note the circled area:

During that spike, it’s reporting over 1Gbps utilisation - on a physical 1Gb link. You can also see that the graph is “choppy”, during periods of peak utilisation. What should be a flat graph is instead bumpy.
What’s happening is that one collection interval was a little longer than the previous one, which meant the counter had increased by more. If you assume a fixed time interval, the calculated speed is too high. The next collection interval was shorter, which meant that the calculated speed was too low. Averaged over the intervals, it would come out about right.
The same product also fails when the collection interval is changed for an interface - e.g if you change the collection interval from 15 minutes to 5 minutes, the historical graphs all show triple the traffic utilisation. Very disappointing.
Other products I’ve used take into account the variation - e.g. if you look at the raw metrics CSV files used between HP NNMi and iSPI Performance, it includes a “Delta Time (Seconds)” column, which can be used to more accurately calculate the interface utilisation.
Real World Problems (2)
Another issue I have seen is with Infoblox systems. These have SNMP counters available for reporting things such as Successful DNS queries. This is a Counter value, and I should be able to poll it at an interval of my choosing, and from there calculate the DNS query rate. Sounds good. But there’s a problem - the values only seem to get updated once per minute. I ran a script to poll a single OID every 10s, and these were the results:
1
2
3
4
5
6
7
8
9
10
11
Counter64: 30367166
Counter64: 30367166
Counter64: 30374550
Counter64: 30374550
Counter64: 30374550
Counter64: 30374550
Counter64: 30374550
Counter64: 30374550
Counter64: 30382267
Counter64: 30382267
Counter64: 30382267
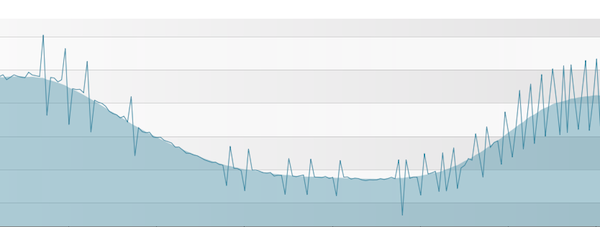
See the problem? It’s only updating the results every minute. If I happen to poll it at exactly the same interval, I’ll probably be OK. But what if my polling cycles vary slightly, and are maybe 1s either side of exactly 300s? Then I get graphs like this: The polled values are jittering around my smoothed trend. This is all because the Infoblox system is only periodically updating that counter.
Do It Right
If you’re writing your own simple collection script that is pulling values from a Counter, it’s probably OK to assume a fixed interval. But if you’re writing anything serious, you need to make sure your calculations take natural variation into account. It’s not OK to assume a perfect world where everything happens at exactly the time interval you schedule it for.
Similarly, if you’re writing the code behind a Counter value, make sure it increments in real-time, not at scheduled intervals.