IMC Compliance - Display Commands
This article is Part 6 in a 7-Part Series.
- Part 1 - IMC Compliance - Overview
- Part 2 - IMC Compliance - Walkthrough
- Part 3 - IMC Compliance - Scheduling Tasks
- Part 4 - IMC Compliance - Advanced Policies
- Part 5 - IMC Compliance - Recovery Commands
- Part 6 - This Article
- Part 7 - IMC Compliance - Testing Rules
What Are Display Commands?
‘Display Commands’ are sets of commands we can configure in IMC, to run as part of Compliance Checks. Rather than just checking through the running or startup configuration, IMC will actively login to the devices, and run the given commands. You can then use Compliance rules to look at the output of those commands, either matching or excluding specific patterns. This opens up more possibilities for your compliance checking - e.g. You can check that NTP is actually working, not just configured.
Walk Through Example
Let’s walk through an example, showing how to check that NTP is actually working on a Cisco device. First, we need to know what command we want to run, and we want to know what output we expect to see if it is working as expected. Here’s a working example:
1
2
3
4
5
6
sw02pi#show ntp status
Clock is synchronized, stratum 3, reference is 172.16.2.40
nominal freq is 119.2092 Hz, actual freq is 119.2077 Hz, precision is 2**18
reference time is D5F65C65.21DA3BF2 (21:48:37.132 NZDT Wed Oct 2 2013)
clock offset is 3.9404 msec, root delay is 33.98 msec
root dispersion is 64.51 msec, peer dispersion is 8.59 msec
And here’s a non-working example:
1
2
3
4
5
6
sw03pi#show ntp status
Clock is unsynchronized, stratum 16, no reference clock
nominal freq is 119.2092 Hz, actual freq is 119.2080 Hz, precision is 2**18
reference time is D5F65BD3.A81560DA (21:46:11.656 NZDT Wed Oct 2 2013)
clock offset is 4.5686 msec, root delay is 33.81 msec
root dispersion is 60.85 msec, peer dispersion is 5.98 msec
Note the key output difference there in the first line. That’s what we’ll later use for our testing.
To use Display Commands in our Compliance Policies, we first need to define the commands. Do this by going to Service -> Compliance Center -> Display Command, and click Add:
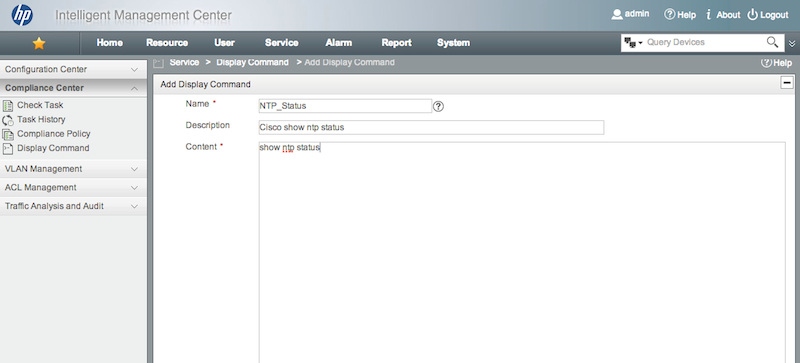
Give it a name, a description, and fill in the command, in this case “show ntp status”. Click OK. Note that commands are not associated with vendors or devices - you might like to put the vendor in the name or description. You now need to use this command in a policy rule.
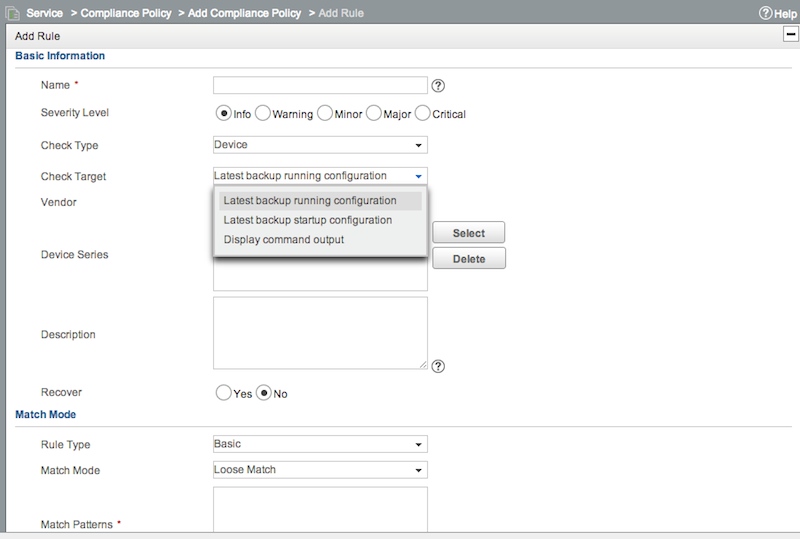
Create a new policy if required, then add a rule to it. This time, under “Check Target”, choose “Display command output”:
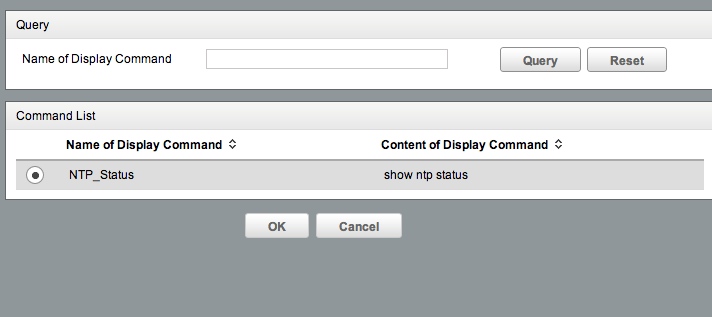
You can now click Select, to choose your command:
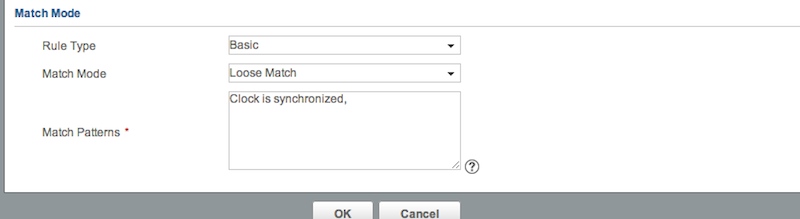
Set the Vendor , and/or device series as required. Set the Recovery commands if wanted. Now, under “Match Mode”, you can create a rule like you normally would - but this time we will be matching against the output of our command, not the saved configuration. Here’s what we need:
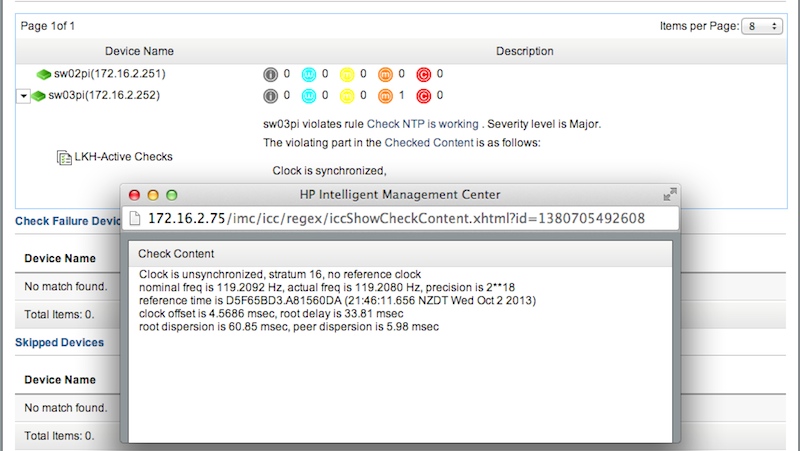
Save that, and save the policy. Now create either a One-Off or Periodic Task, using our new policy. This is configured the same way as normal. What you’ll notice is that the task will take a bit longer to run. Normally passive checks only take 5-10s to run. But if you’re running active checks against hundreds of devices, it may take quite a while to complete. Once completed, you can view the results the same way as normal. One difference is that if a device has failures, and you follow the “Checked Content” link, you’ll see that it’s showing the full command output:
Conclusion
Using Display Commands can be really powerful, and opens up a lot more possibilities than just looking at configurations. Running active commands means you can verify that your network is actually operating the way you expect. Remember, it’s like grading a CCIE exam - all the really matters is the results of your configuration, not the config itself.