Andrisoft Wanguard: Cost-Effective Network Visibility
Andrisoft Wansight and Wanguard are tools for network traffic monitoring, visibility, anomaly detection and response. I’ve used them, and think that they do a good job, for a reasonable price.
Wanguard Overview
There are two flavours to what Andrisoft does: Wansight for network traffic monitoring, and Wanguard for monitoring and response. They both use the same underlying components, the main difference is that Wanguard can actively respond to anomalies (DDoS, etc).
Andrisoft monitors traffic in several ways - it can do flow monitoring using NetFlow/sFlow/IPFIX, or it can work in inline mode, and do full packet inspection. Once everything is setup, all configuration and reporting is done from a console. This can be on the same server as you’re using for flow collection, or you can use a distributed setup.
The software is released as packages that can run on pretty much any mainstream Linux distro. It can run on a VM or on physical hardware. If you’re processing a lot of data, you will need plenty of RAM and good disk. VMs are fine for this, provided you have the right underlying resources. Don’t listen to those who still cling to their physical boxes. They lost.
Anomaly Detection
You define what constitutes an anomaly - e.g. traffic above a certain fixed rate, or statistically abnormal, unusual traffic types, etc. You configure what response you want to take, and for how long. The response can be to run a script, inject routes into BGP for RTBH, or block specific traffic if you’re using it inline. If you’re using BGP RTBH, Wanguard runs Quagga locally, and peers with your routers. Either when the anomaly is over, or after some fixed window, the response action is withdrawn. This is all fairly straightforward to set up, but you will want to play around with timers and traffic rates, until you get something that works well for your environment. You need a balance between reacting too soon and too late to DDoS traffic.
Reporting
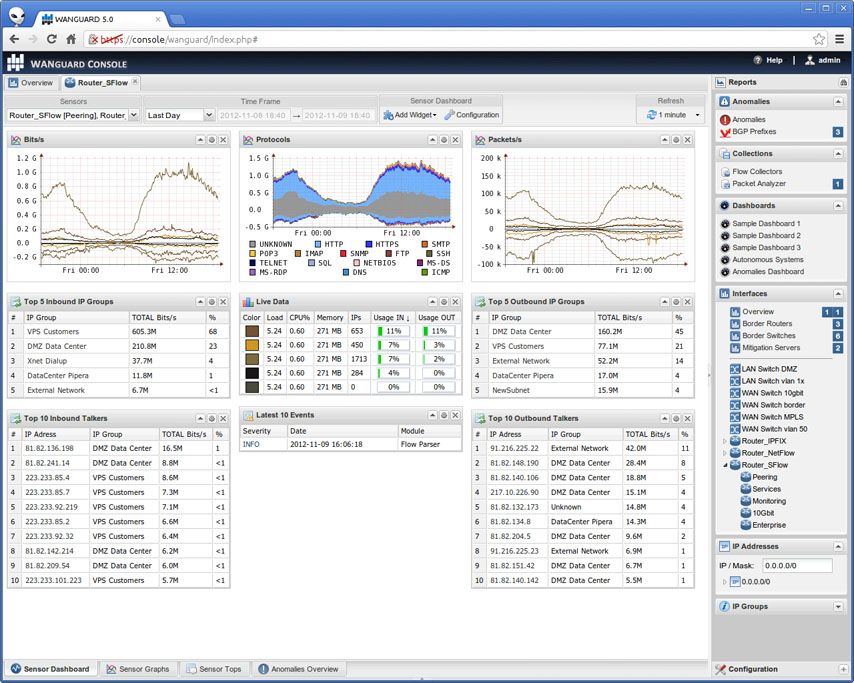
Andrisoft provides a web console that consolidates data from all the sensors. You can configure your own dashboards with whatever combination of data you want - e.g. You might have a list of the current top talkers, graphs showing traffic per region over the last 24 hours, and a list of the top ASNs.
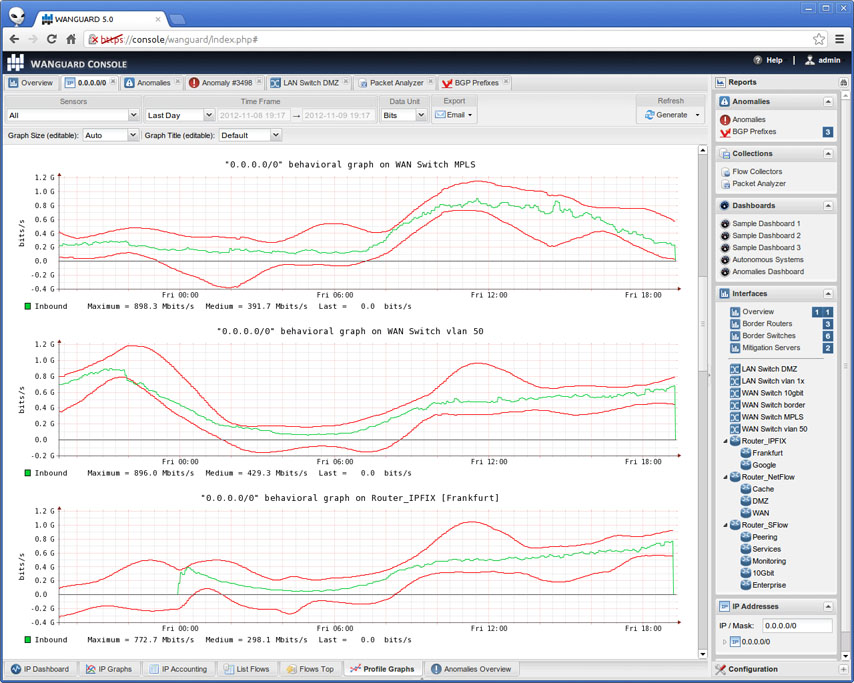
From the dashboard you can run reports on say a specific IP, or a specific protocol, looking at volumes, rates, graphs, etc.
You can also see what anomalies were detected, and what actions were taken. If you have RTBH set up, you can manually inject a prefix from the dashboard, and set a time for when you want it to expire. Very handy for when you need to block a specific IP for some reason.
What about DIY?
I could create a similar system to Wanguard using a combination of NfSen, NFDump, some custom scripting and a bit of other ‘magic glue’. But my time isn’t free, and given that Wanguard is $595/year per sensor, it’s not a hard choice.
There are plenty of alternatives out there with fancier GUIs and setup that is more ‘turnkey.’ But none of them are cheap. If you don’t have any good network visibility right now, and you’ve been put off by high prices, I recommend trialling Wanguard. It might just do what you need, at a price you can digest.

