TruView Live Application Monitoring
Fluke Networks recently released TruView Live, a subscription-based service for monitoring internal & external applications. Tests can run from Fluke-managed cloud locations, your own systems, or from dedicated hardware appliances. I’ve been testing it out, and I like it so far.
Provisioning
Overall setup is pretty straightforward. Choose what you want to monitor, and how you want to monitor it - from AWS locations, from your own server, or from a dedicated hardware device.
Global Pulse
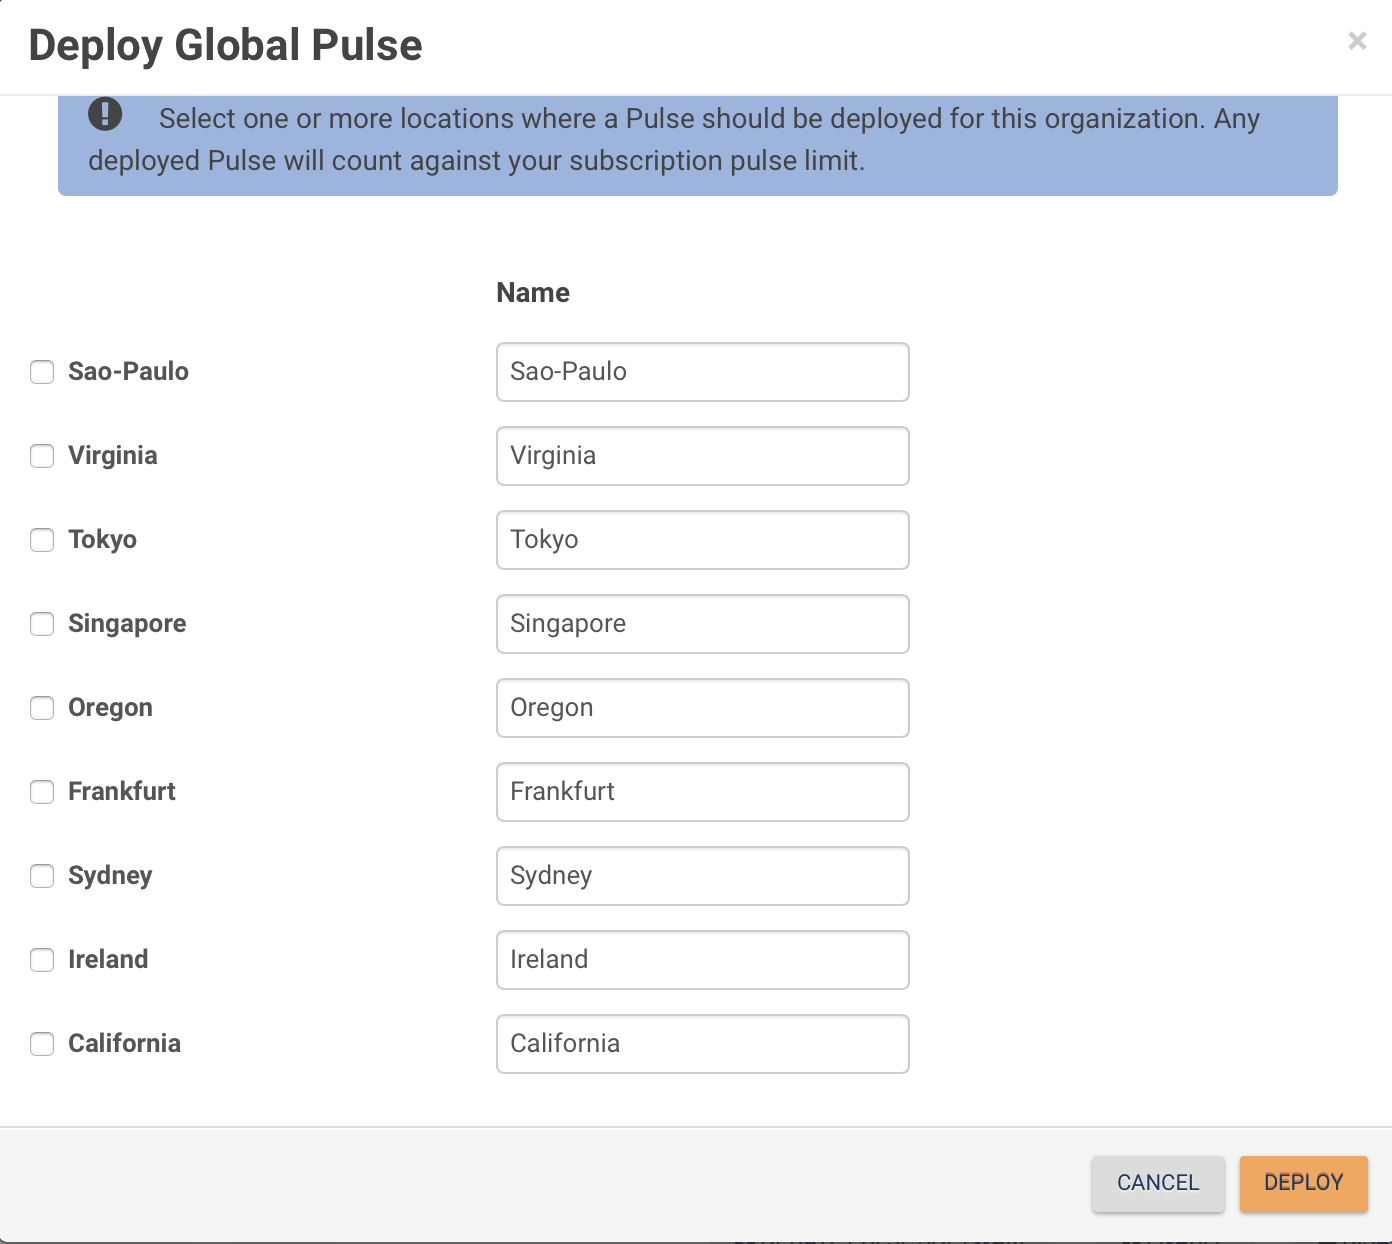
Global Pulses run on Fluke-managed AWS instances. You just pick the Global Locations you want to run from, and assign tests as needed.
Go to Administration -> Pulses -> Deploy Global Pulse. Select the locations you want, and click Deploy.
Virtual Pulse
A Virtual Pulse is an application running on Windows (7/8/2008/2012) or Linux systems (RHEL 7.0, Ubuntu 14.04). This does not need to be a dedicated device - e.g. You might need to run tests from a remote worker’s laptop. They give you an option to email install instructions - handy if you’ve got non-technical staff who need to install the agent.
Setup is pretty straightforward. I used DigitalOcean to host it. Go to your DigitalOcean dashboard, and create a droplet. Pick the smallest size ($5/month), and leave it at Ubuntu 14.04 x64.
While that’s being created, go to your TruView Dashboard, and go Administration -> Pulses. Click “Download Virtual Pulse” and look for the Linux install instructions. They’ll look something like this:
1
2
3
curl -L https://app.truviewlive.com/install -o setup.sh
chmod +x setup.sh
./setup.sh beefcccc-e040–44ba-a692-db25aa88ddee
(Obviously your key will be different).
Once your Droplet is up & running, ssh to it. Run apt-get install unzip first, and then run the above instructions (if you don’t install unzip, the setup will fail). It will automatically pick up the tests that are set to run on All Pulses. If you have some tests set to only run on specific Pulses, you’ll need to assign those to the new Pulse.
You should see the Pulse show up in the Dashboard, and test results will start coming through shortly.
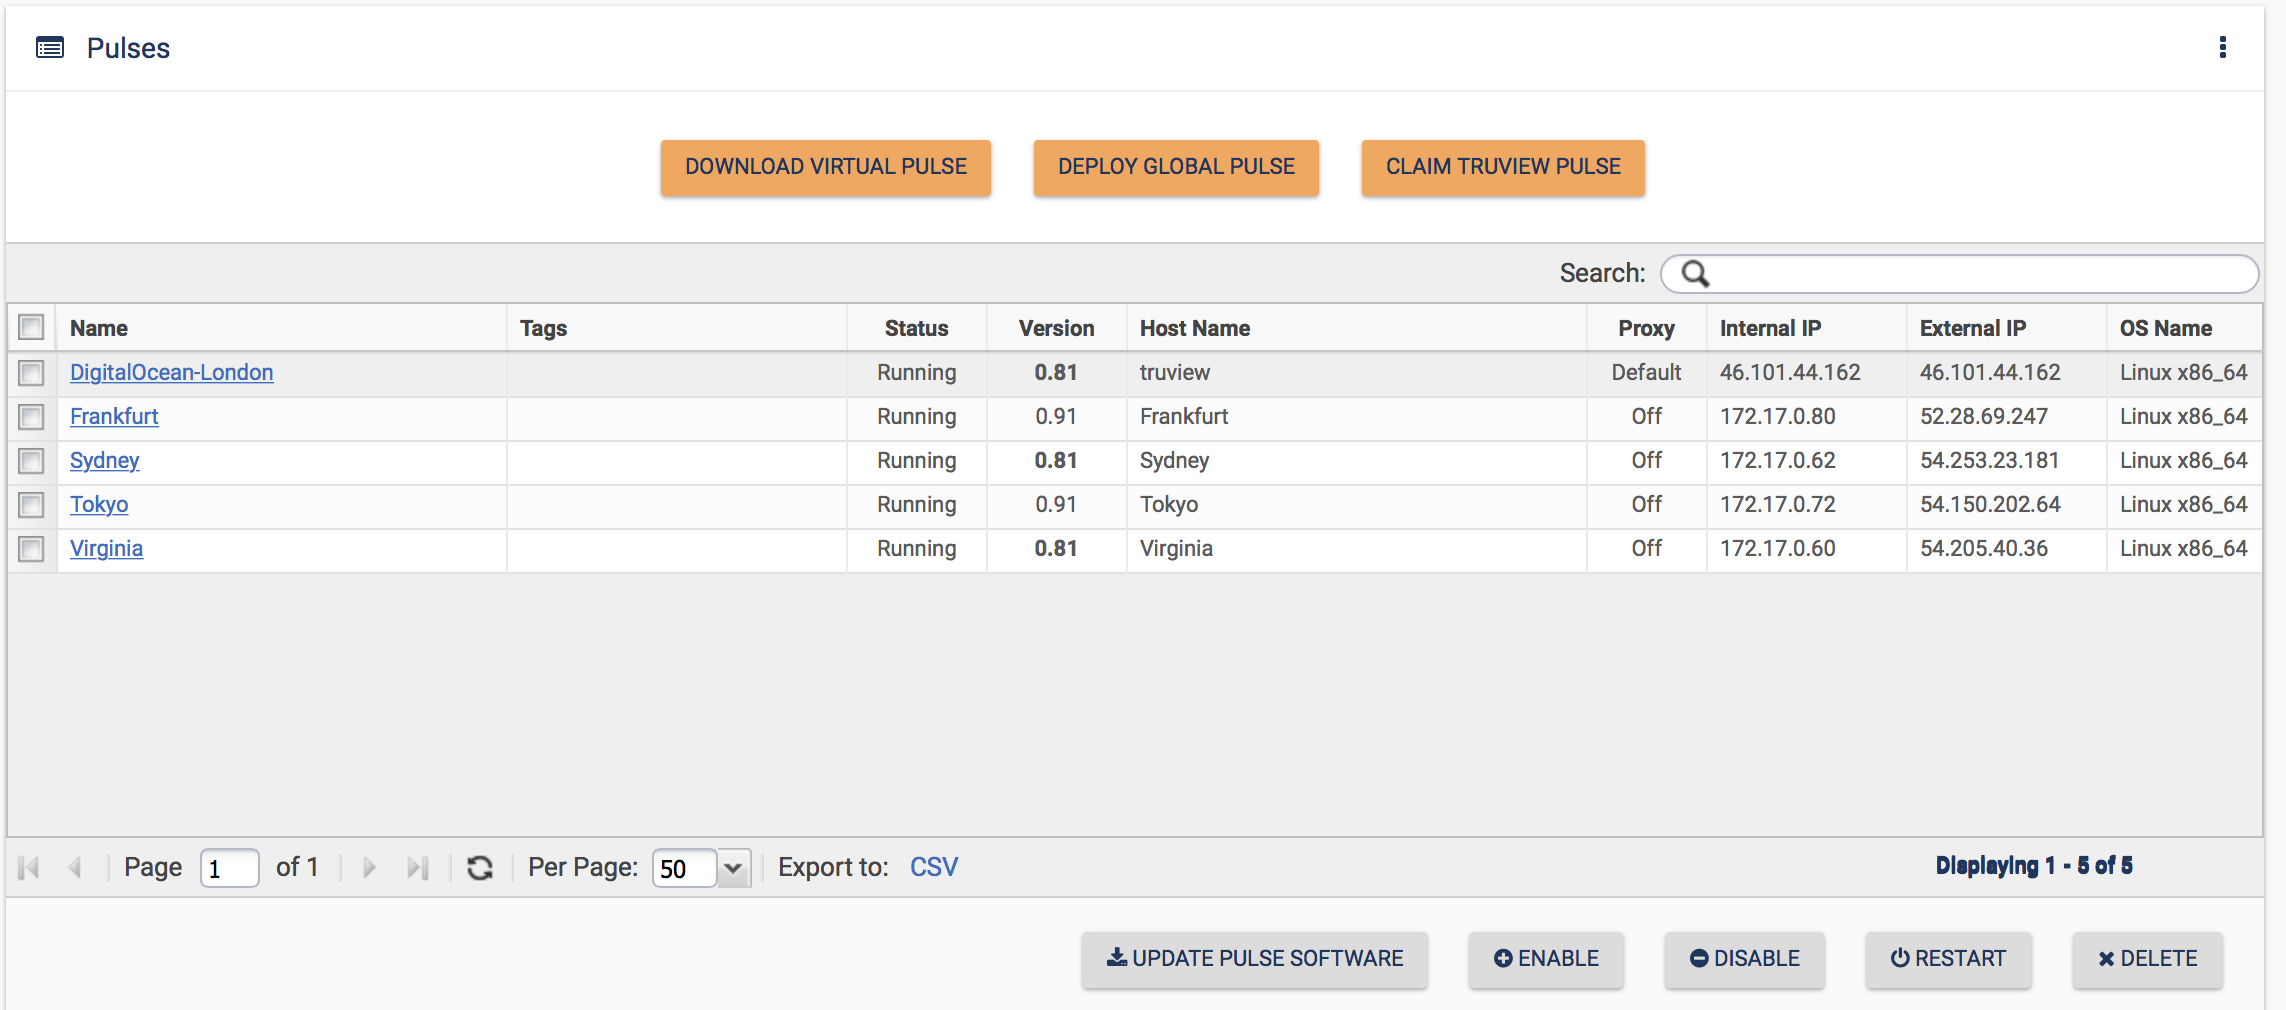
Pulse updates are done through the Dashboard. You can deploy new software versions from the Dashboard, without needing to login to your servers.
TruView Pulse
I didn’t use any of the physical Pulses in my testing. If you are using them, you plug it in, and it shows up in your Dashboard. You can then name it, and assign tests.
Monitored Services
Currently you can only configure HTTP(S) tests, but VoIP and IP SLA-type tests are coming soon.
To set up a new test, go to Administration -> Monitored Services -> Create New.
Give it a name, and choose if you want to run it on all pulses, or a subset. The default test frequency is 5 minutes. You can set this to anything between 1 min & 60 minutes.
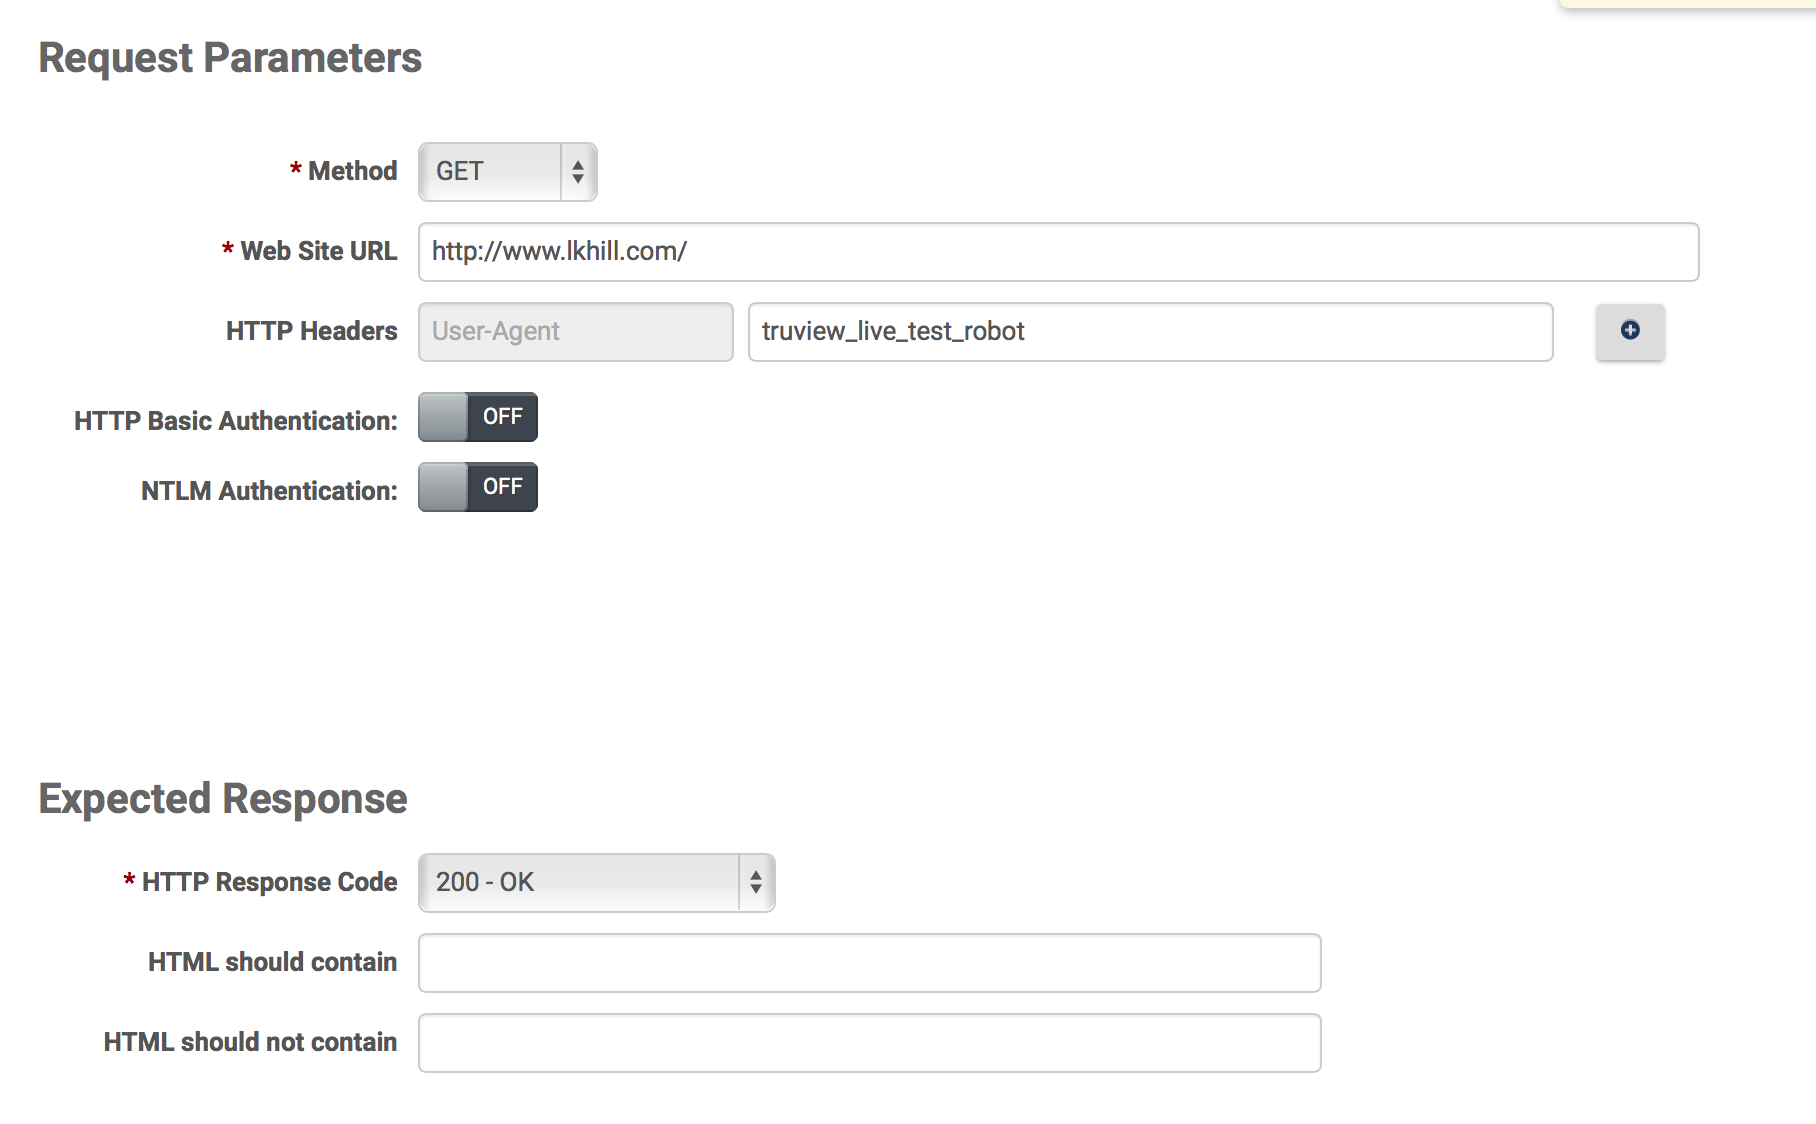
You can do a GET or a POST, and you can set your own HTTP headers. You can also look for specific response codes, and/or specific text.
You may need to change the default thresholds. You can set global response time thresholds, or change them for specific tests. The defaults are 3.0s for Degraded & 6.0s for Excessive. This was a bit sensitive for testing my site from Sydney. Change this at Administration -> Thresholds.
Viewing Results
OK, finally the good stuff: Looking at the results.
There are three Dashboards:
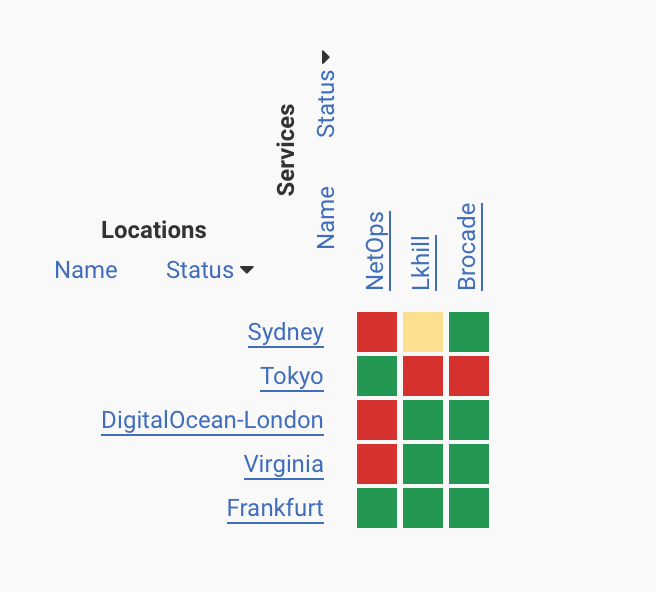
- Enterprise: This shows a matrix of locations & tests
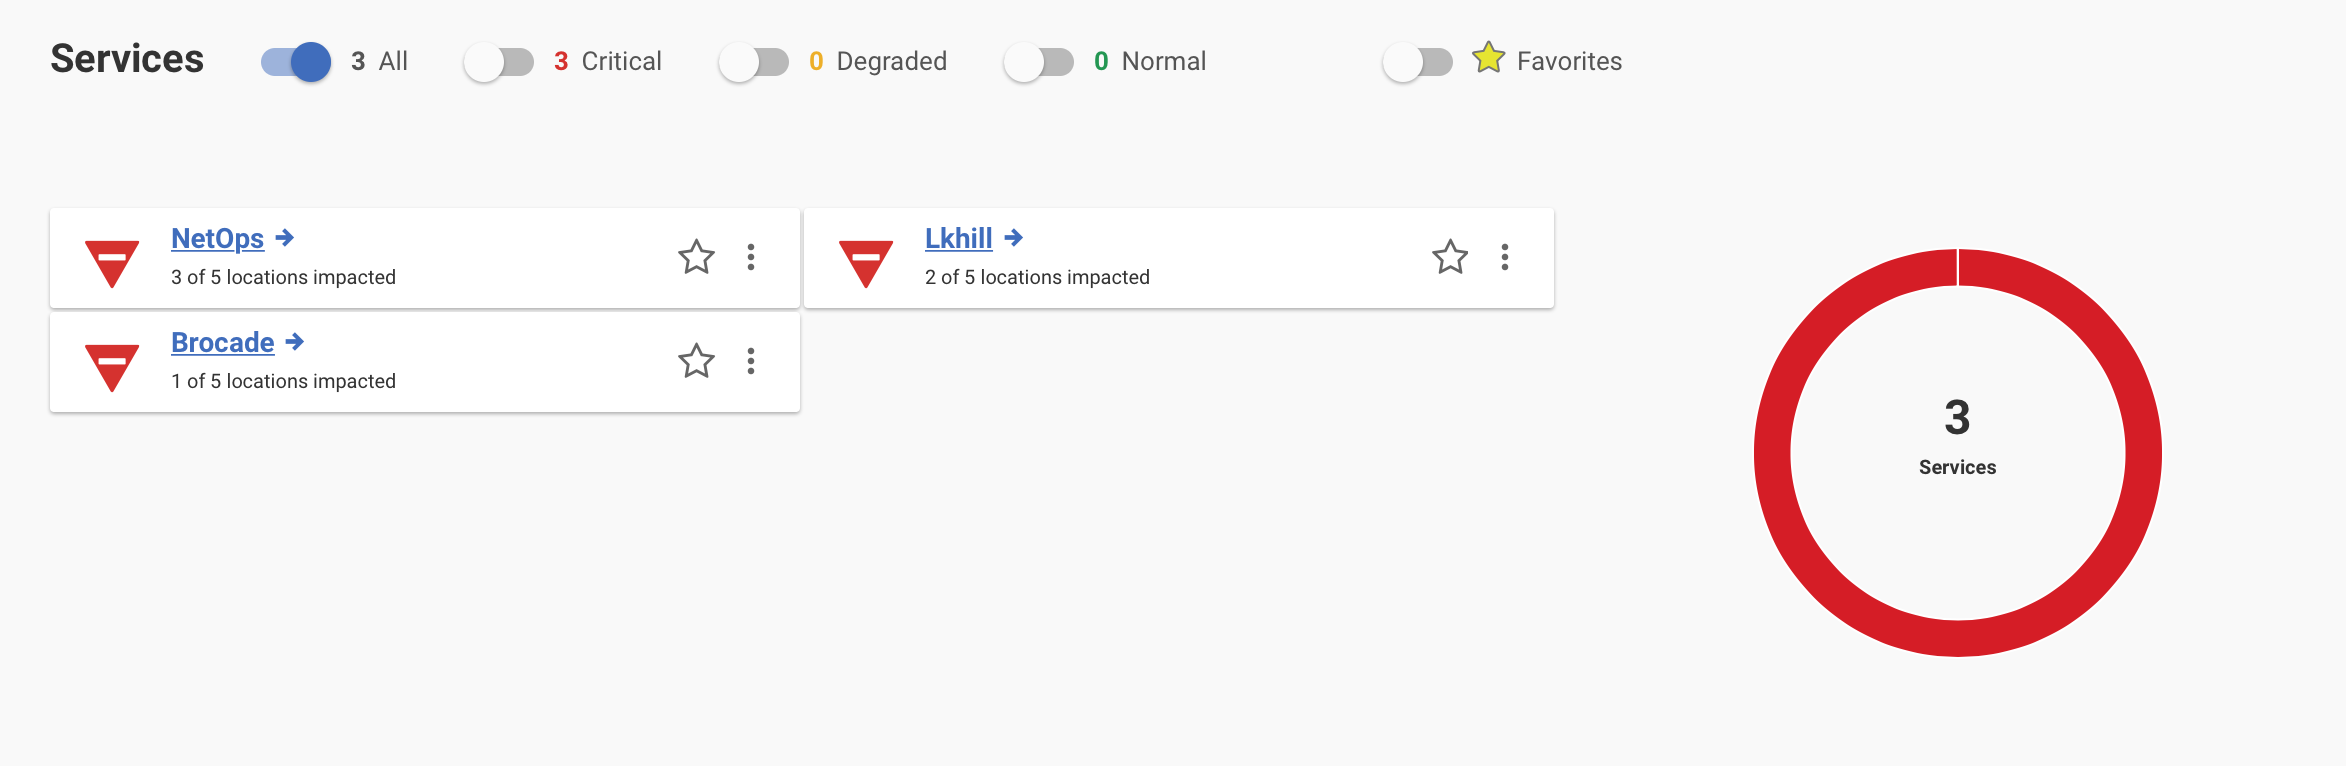
- Services: Service-focused view, showing overall status for each monitored service.
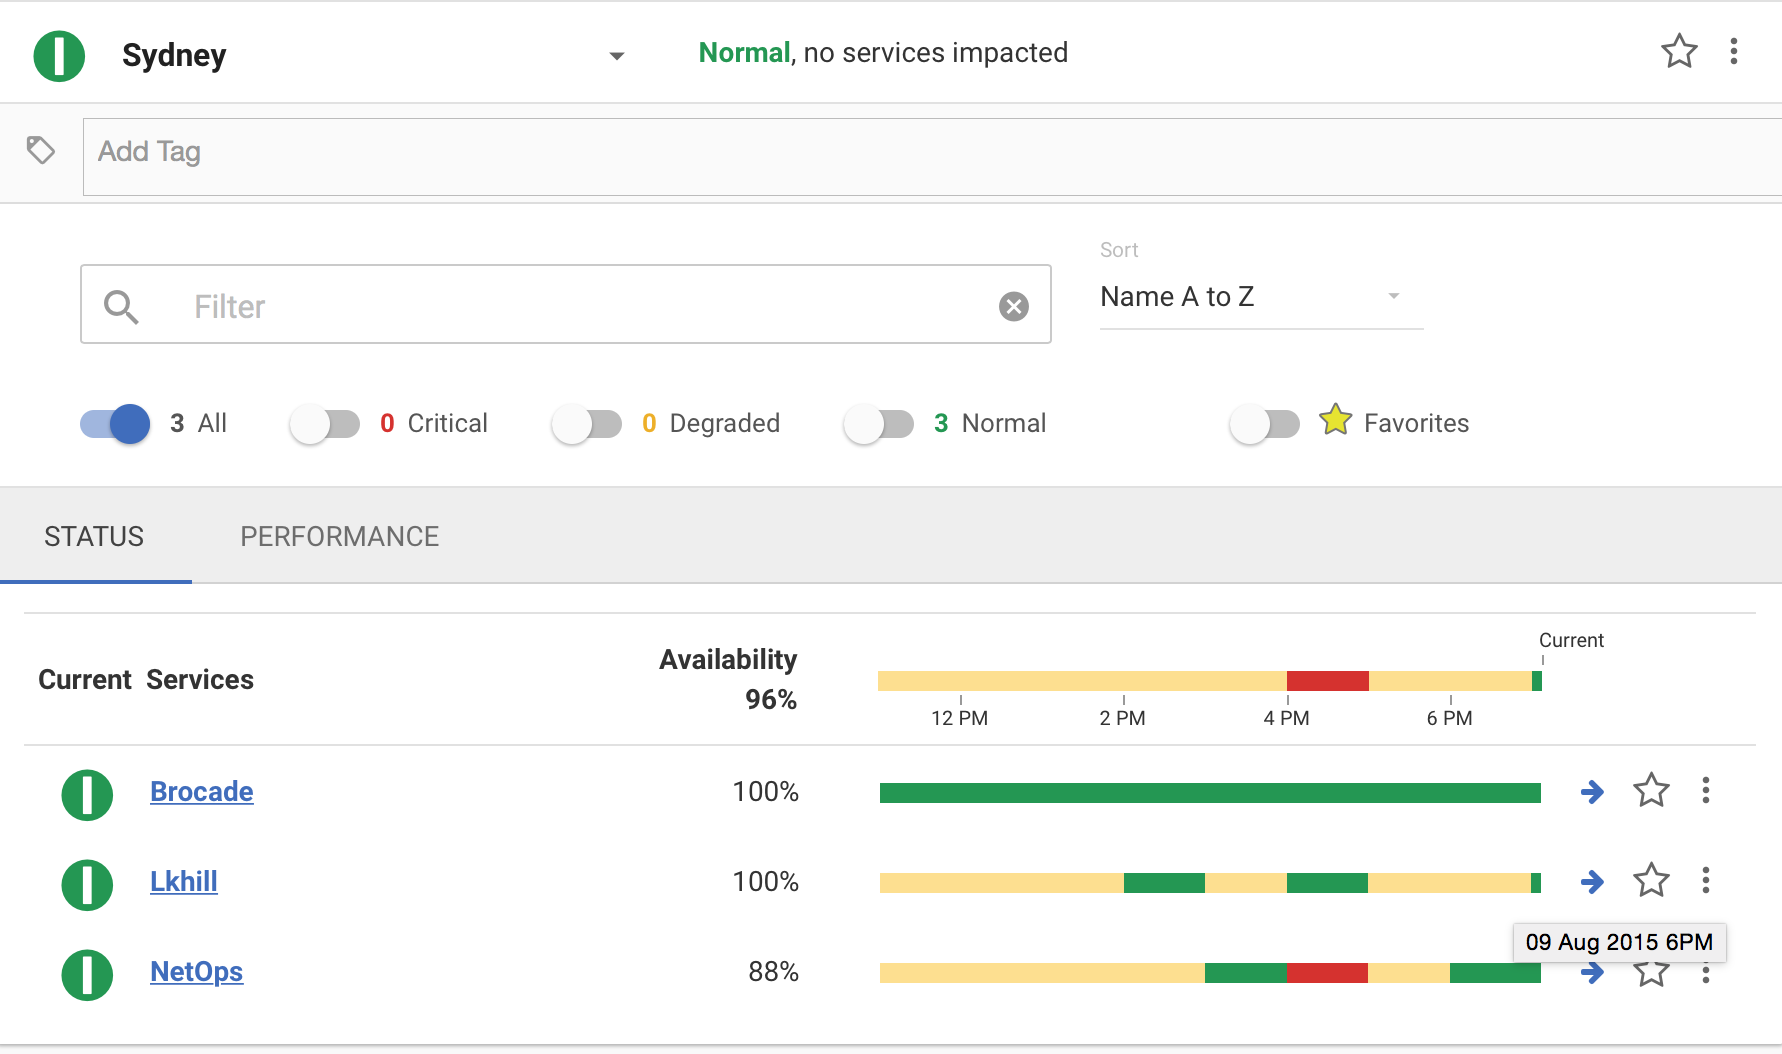
- Location: Location-focused view, showing results of tests on a per-location basis.
All views let you set the time range. From the top right, click the button, and you can select the time range:
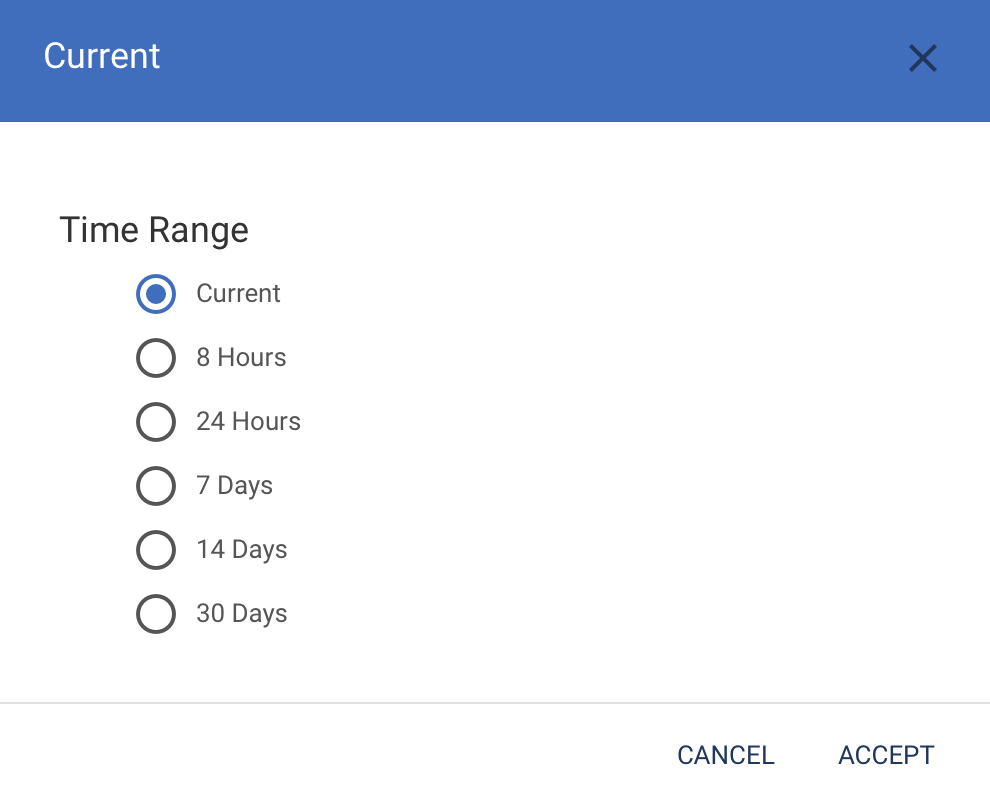
What I like about this is that if you change it to say “Last 24 hours”, it will show the worst status for each service/location during that period. Usually Dashboards only show you the current status. To find out if there were problems overnight you need to look at the Event Log. But this approach lets you get a quick feel for any problems that happened recently, so you can drill down to find out more.
Enterprise Dashboard
From the matrix you can drill down to any test + location combo. That will show a log of results.
Services Dashboard
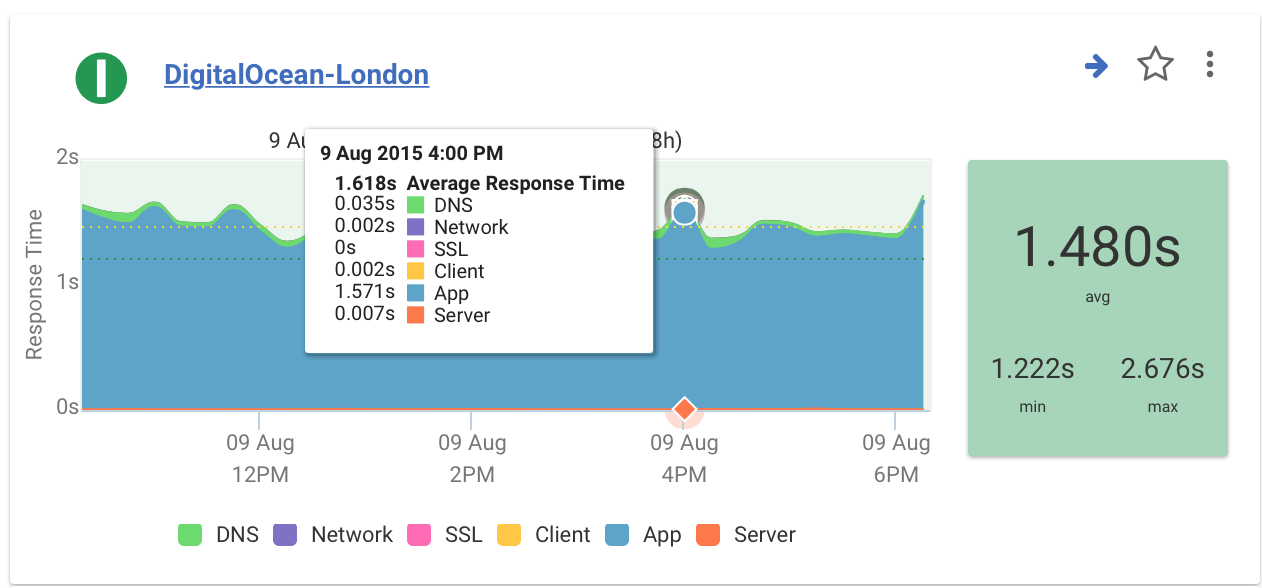
From the Services View, pick a service, and then click the Performance tab. That gives you a breakdown of the various delay components - DNS, Server, Network, etc. This can throw up some interesting anomalies - e.g. My site has an App delay of ~1.4s when measured from London, but 2.5s when measured from Sydney. This is because I’m using CloudFlare. The use of proxies can confuse some measurements.
Locations Dashboard
This gives you a view of all services measured from a specific location. Note you can see how it’s changed over time. That time window is adjustable.
Quis custodiet ipsos custodes?
I appreciate that TruView are being very open with their status reporting. status.truviewlive.com shows their current status, response times, and incident log. It’s not easy airing your dirty laundry, but I like it when I see a few incidents published. I’d rather know what was going on than not know.
All up this is a pretty nice service. I’d like to see how they might integrate this data with that from the NetScout & Arbor parts of the business. That merger is fairly recent though, so those details are still being worked through.