Polling XML Values with ScienceLogic
Most Network Management Systems are built to make it easy to poll data via SNMP. But ‘interesting’ data is not always available via SNMP. Sometimes it’s in another format, such as XML. I’m working with ScienceLogic quite a lot recently, and it makes it easy to poll that data, alert on it, and integrate it with all the other sources of data, into dashboards, reports, etc. Here’s a quick walk-through of polling data in XML format, and adding it to ScienceLogic.
Portland Temperature
I’m going to use the NOAA weather data as an example of data in XML format. Let’s assume we wanted to poll the temperature for Portland, Oregon, and display it on a graph. Here’s what our data source looks like:
1
2
3
4
5
6
7
8
9
10
11
12
13
14
15
16
17
18
19
20
21
22
23
24
25
26
27
28
29
30
31
32
33
34
35
36
37
38
39
40
41
42
43
44
45
46
47
48
49
50
<xml version="1.0" encoding="ISO-8859-1"?>
<xml-stylesheet href="latest_ob.xsl" type="text/xsl"?>
<current_observation version="1.0"
     xmlns:xsd="http://www.w3.org/2001/XMLSchema"
     xmlns:xsi="http://www.w3.org/2001/XMLSchema-instance"
     xsi:noNamespaceSchemaLocation="http://www.weather.gov/view/current_observation.xsd">
    <credit>NOAA's National Weather Service<credit>
    <credit_URL>http://weather.gov/<credit_URL>
    <image>
        <url>http://weather.gov/images/xml_logo.gif<url>
        <title>NOAA's National Weather Service<title>
        <link>http://weather.gov<link>
    <image>
    <suggested_pickup>15 minutes after the hour<suggested_pickup>
    <suggested_pickup_period>60<suggested_pickup_period>
    <location>Portland, Portland International Airport, OR<location>
    <station_id>KPDX<station_id>
    <latitude>45.59578<latitude>
    <longitude>122.60917<longitude>
    <observation_time>Last Updated on Mar 27 2015, 7:53 pm PDT<observation_time>
        <observation_time_rfc822>Fri, 27 Mar 2015 19:53:00 -0700<observation_time_rfc822>
    <weather>Overcast<weather>
    <temperature_string>61.0 F (16.1 C)<temperature_string>
    <temp_f>61.0<temp_f>
    <temp_c>16.1<temp_c>
    <relative_humidity>63<relative_humidity>
    <wind_string>Southwest at 13.8 MPH (12 KT)<wind_string>
    <wind_dir>Southwest<wind_dir>
    <wind_degrees>220<wind_degrees>
    <wind_mph>13.8<wind_mph>
    <wind_kt>12<wind_kt>
    <pressure_string>1017.5 mb<pressure_string>
    <pressure_mb>1017.5<pressure_mb>
    <pressure_in>30.05<pressure_in>
    <dewpoint_string>48.0 F (8.9 C)<dewpoint_string>
    <dewpoint_f>48.0<dewpoint_f>
    <dewpoint_c>8.9<dewpoint_c>
    <windchill_string>59 F (15 C)<windchill_string>
        <windchill_f>59<windchill_f>
        <windchill_c>15<windchill_c>
    <visibility_mi>10.00<visibility_mi>
    <icon_url_base>http://forecast.weather.gov/images/wtf/small/<icon_url_base>
    <two_day_history_url>http://www.weather.gov/data/obhistory/KPDX.html<two_day_history_url>
    <icon_url_name>novc.png<icon_url_name>
    <ob_url>http://www.weather.gov/data/METAR/KPDX.1.txt<ob_url>
    <disclaimer_url>http://weather.gov/disclaimer.html<disclaimer_url>
    <copyright_url>http://weather.gov/disclaimer.html<copyright_url>
    <privacy_policy_url>http://weather.gov/notice.html<privacy_policy_url>
<current_observation>
The key part is between the
Once that’s done, we’ll assign the credential and Dynamic Application to a device, and it should start collecting data.
XML Credentials
Go to System -> Manage -> Credentials, and go Create -> SOAP/XML Credential. You’ll get a pop-up like this:
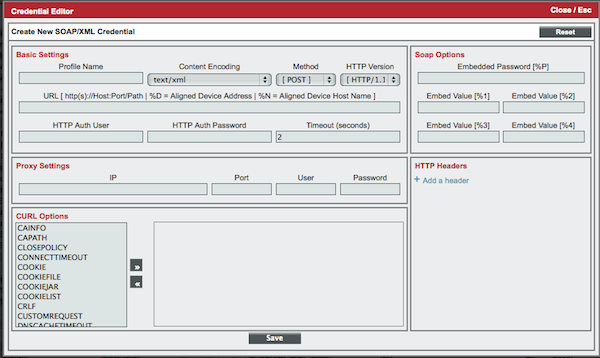
Give it a name - in this case we’ll use “PortlandWeather”, and set the URL to http://w1.weather.gov/xml/current_obs/KPDX.xml. You’ll see there’s a heap of other settings we could set for authentication, headers, etc, but in this case we can leave them all at default. Note that ScienceLogic takes cURL options. So if you’ve done your testing with cURL, and you’ve been using some custom options, it should be very easy to transfer.
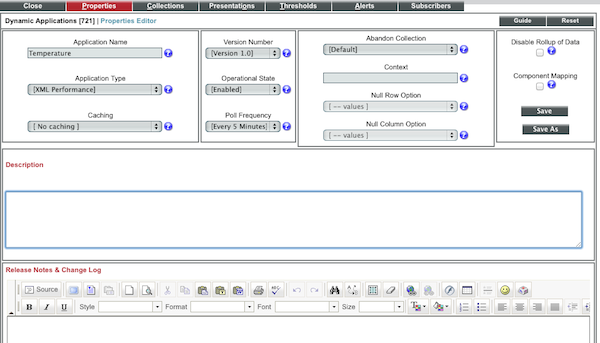
Dynamic Application
Now we need to set up the XML tag parsing, and how to present the data. Go to System -> Manage -> Applications. Click on Actions -> Create New Dynamic Application. On the first page, set the Application Type to “XML Performance”, set the name, and set the Poll Frequency (5 minutes in this case). Then click Save, and it should look like this:
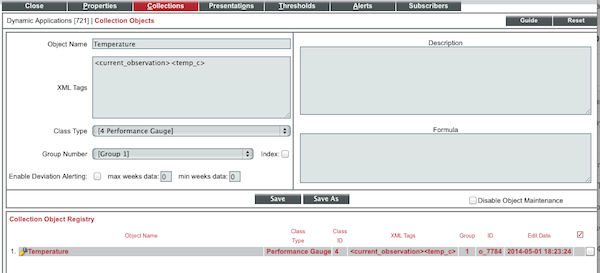
Go to the Collections tab. This is where we tell ScienceLogic which tags we’re looking for, what format the data is in, and any formulae/translations that need to be applied. Let’s give our collection a name “Temperature”, and then put in the tags we’re looking for. This is in the format <parent tag>...<intermediate tag(s)>...<node tag>. Looking through our XML above, we can see that we just need <current_observation><temp_c>. We could apply a formula here - e.g. to convert between Fahrenheit and Celsius - and we can also set a Description. We don’t need to do any of that. The other key item is the “Class Type” - this tells ScienceLogic how to handle that data. If it was an Interface counter, it would always go up, and ScienceLogic would need to calculate the rate of change. It could also be a text label. But in this case it’s a value that can go up and down, and we want to plot the current value. So we use “Performance Gauge”:
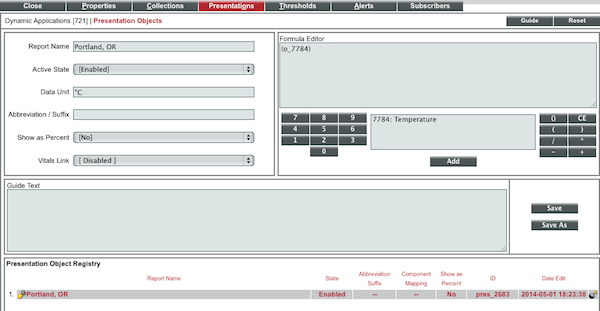
Save that, then go to the Presentations tab. This defines which values get displayed, and we can apply more formulae if required. We can set pop-up guide text, and the display units. Click on the Wrench next to our item, and change the name to “Portland, OR”, and set the data unit to ºC. Make sure you set the “Active State” to Enabled:
We won’t worry about Thresholds or Alerts yet. Save that, and let’s put it together.
Pulling it Together - Devices, Applications and Credentials
We’ve created the pieces, now we need to pull it together, so it starts collecting data.
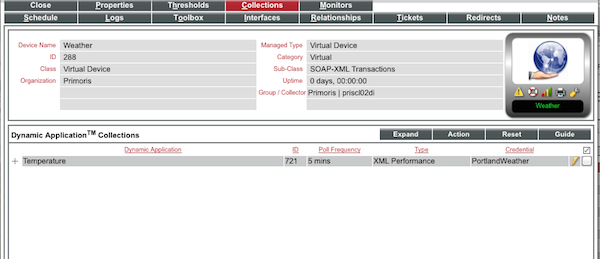
First, we need a device to associate the data with. You might already have one, or you can create a “Virtual” Device. Go to Registry -> Devices -> Device Manager, then Actions -> Create Virtual Device. Create a Virtual SOAP-XML Transactions Device, and call it “Weather”.
Now open the Device Properties page for that device, and go to the Collections tab. Go Action -> Add Dynamic Application. Scroll down and find your new Temperature Application. Now select the PortlandWeather Credential on the right-hand side, and click Save. You should now have this:
At this point, we should be all good. You could click the Lightning Bolt icon, to test it out and review the debugs, or you can just go to the Device Performance tab, and look for the data (you may have to wait a few minutes for it to start showing up). You should start to see something like this:
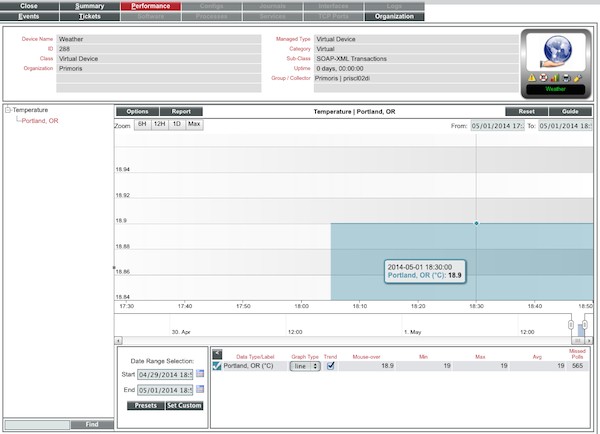
Easy as that! Obviously that’s a fairly simple example, but you can start to do much more interesting things. It gets much more interesting if you start looking at caching results, and re-using them elsewhere. The basic XML polling will only take you so far though - sooner or later you need to do some custom data manipulation. That’s when you move to “Snippet” applications, that let you insert custom Python code. Very powerful, but a bit more complicated.