Scalyr - More than Just Logs
Earlier this year I came across Scalyr, a newer player in the cloud-based log management scene. They’re taking a slightly different approach to products like Loggly and Splunk. I’ve been testing it in my lab - here’s my impressions.
What is Scalyr?
Scalyr is a server monitoring tool built by ex-Google engineers. It brings together log data, system metrics, website monitoring and alerting. Scalyr says:
We built the comprehensive server monitoring tool we always wanted.
The key features are:
- Cloud-based - all backend stuff is abstracted away
- Uses a server agent.
- Ingests logs in variety of formats
- Searching, alerting, reporting and visualisation for logs
- Server metric monitoring - CPU, process, disk, memory, etc. Not just logs.
- External website monitoring
- API for inserting data, retrieving results, and changing configurations
There’s more detail on the features here.
I think it’s crucial to have a log consolidation tool, as we’re well past the days of being able to manually search each log file on every application server. It just doesn’t scale at all - you must have that data in one place. But the interesting point here is that they’re also trying to bring in the monitoring components. Other log management tools focus on the logs, and gloss over the other parts of application monitoring.
Pricing is based on daily log volume, and retention period. Starts at 0.5GB/day with 7-day retention for $19/month, and goes up from there. They used to charge per monitored server, but that has been changed - now it’s just volume/retention. I’m pleased they made that change - it makes it simpler to scale your app up/down as required.
Giving it a Whirl
Scalyr offers a free 30-day trial, so I signed up, and set it up to collect data from one of my lab systems. Here’s what I found:
Initial Installation & Configuration
Agent installation is straightforward. They provide a script that adds their Yum/Apt repository, and you then install the agent. You can get a tarball package if you prefer. The only problem: The agent currently requires Java 1.6 or higher. Boo, hiss! I hear they may be moving away from this though.
1
2
3
wget https://www.scalyr.com/scalyr-repo/stable/latest/installScalyrRepo.sh
sudo bash ./installScalyrRepo.sh
sudo yum install scalyr-agent
You need to configure the agent, and add your API key. In a nice touch, the documentation is personalised when you’re logged into their site - so their instructions include your key, and you don’t need to hunt it down from somewhere else.
1
sudo scalyr-agent-config –run_as root –write_logs_key -
(You’re then prompted to enter your API key)
That done, you need to edit /etc/scalyrAgent/agentConfig.json, to define the logs and processes you want to monitor. Here’s some example configuration from my system:
1
2
3
4
5
6
7
8
9
10
11
12
13
14
15
16
17
18
19
20

“logcopier_config”:{
   directories: [
      {
         path: “/opt/iMC/server/conf/log/*.txt“,
         file_attributes: {parser: ”imcLog“}
      }
   ]
}“appmonitor_config”:{
   “applications”:[
      {
         “id”: “scalyr-relay”,
         “commandline_pattern”: “java.*scalyrRelay.jar”
      },
      {
         “id”: “mysqld”,
         “commandline_pattern”: “mysqld.log”
      }
   ]
}
You can see that I’m telling it to read all log files in my IMC logs directory. The second part is telling it what processes to monitor.
After that, start the agent with sudo scalyr-agent start and it begins uploading data.
I also wanted to perform basic HTTP monitoring of a website. This monitoring is done by Scalyr, so this is configured from the main Dashboard. I edited the Monitors configuration, and added this:
1
2
3
4
5
6
7
8
9
10
11

{
   executionIntervalMinutes: 10.0,
   timeoutSeconds: 10.0,
   monitors: [
      {
          type: "http",
          url: "/"
      }
   ]
}
You can do more advanced configuration here, like looking for specific text patterns in the response, or extracting specific fields - e.g. If you’re trying to pull in data via API.
Viewing Data
Now that the data sources are set up, the Scalyr interface starts to get useful. The default setup has an Overview, a Query tab, and a set of example Dashboards.
The Query tab is for classic log searching. By default, it shows all the recent logs. There’s a filter box, where you can narrow down your search for specific patterns. You’ll need to learn the syntax, but it’s reasonably straightforward, supporting most operators that you’d expect. Scalyr automatically identifies “facets” or key fields, that let you further narrow down your search. You can use this to help refine your search string - e.g. To search for logs from a specific server, or for Apache logs across all web servers.
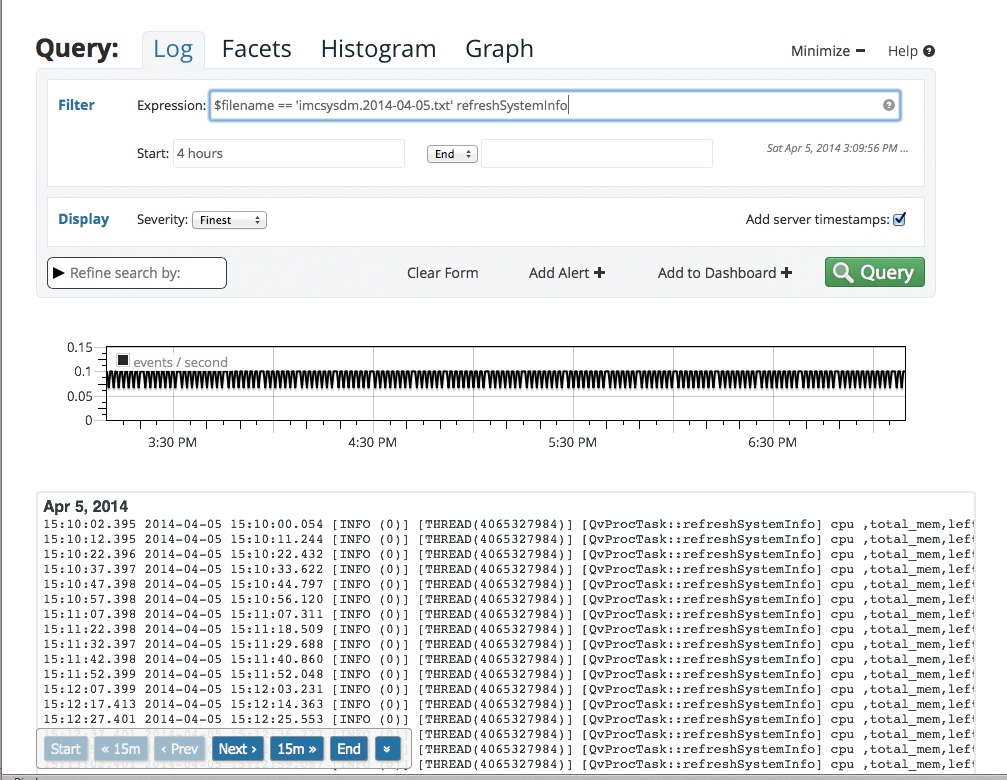
Example query
Looking at the raw text results alone isn’t always very interesting. The Graph tab lets you create a graph using your search results - e.g. By extracting the “response time” value from a web monitor:
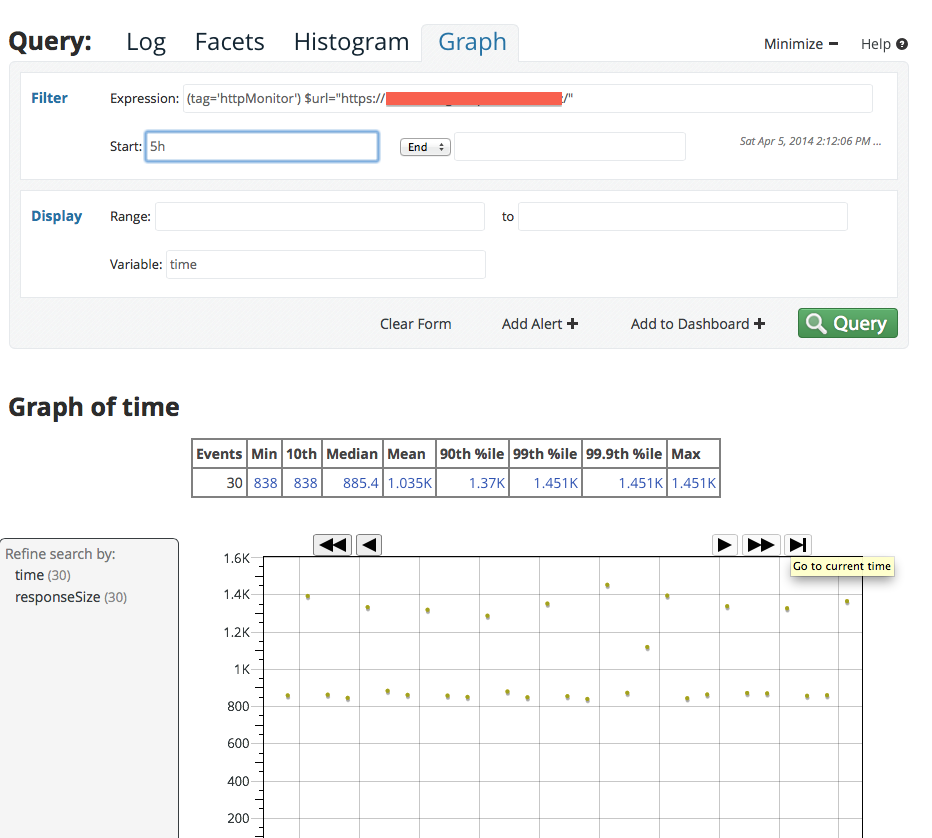
Example graph
All searches and graphs have buttons to create an alert, or add it to a dashboard. Alerts are sent via email to defined addresses. I’d like to be able to submit Alerts to a remote system via API, but sadly email is still the most interoperable format we have.
Dashboards collect a group of related graphs and searches together.
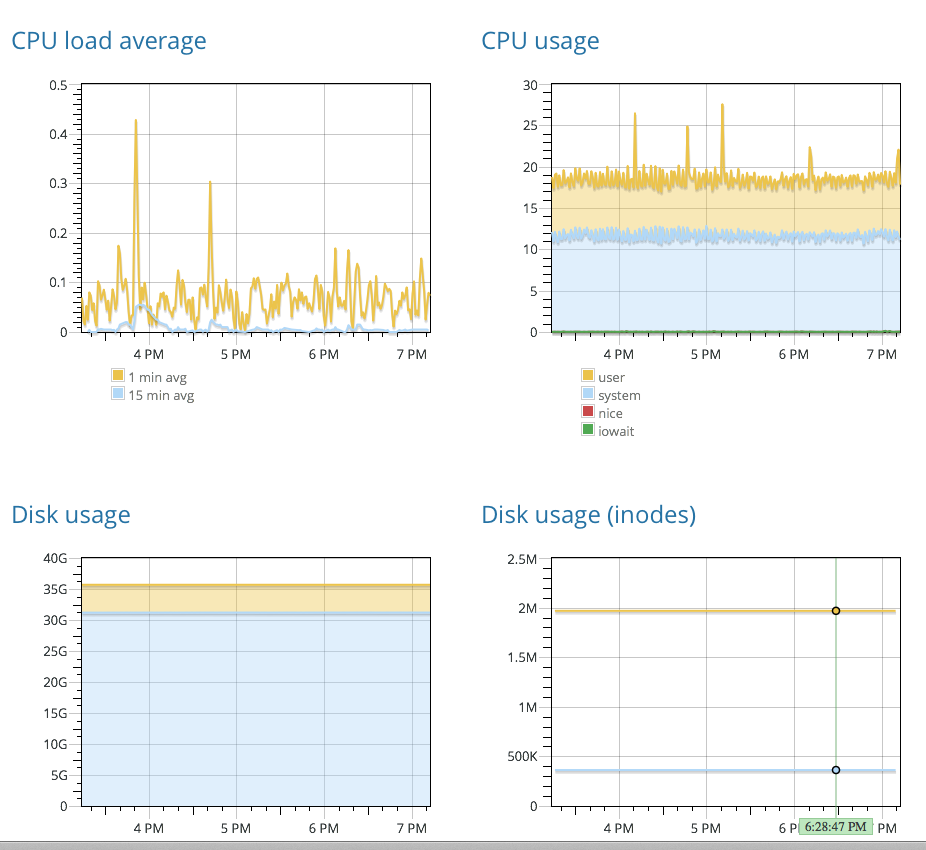
Example Dashboard
They offer a “Wall View” that strips the dashboard back to the minimum, suitable for putting on a big screen.
Dashboard Customisation
The example dashboards are enough to get you up and running, but you’ll want to customise these. Each dashboard has an “Edit Dashboard” link, which takes you to the JSON configuration:
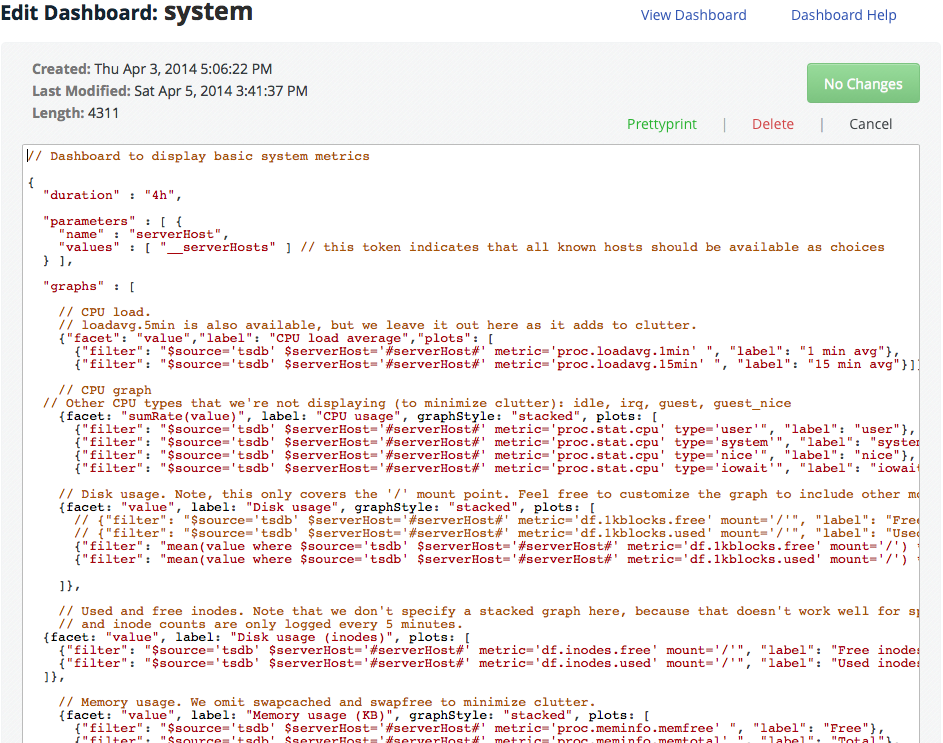
Dashboard Config
You can also create a new dashboard, and paste in your configuration. I did this to create a dashboard showing my process monitoring data:
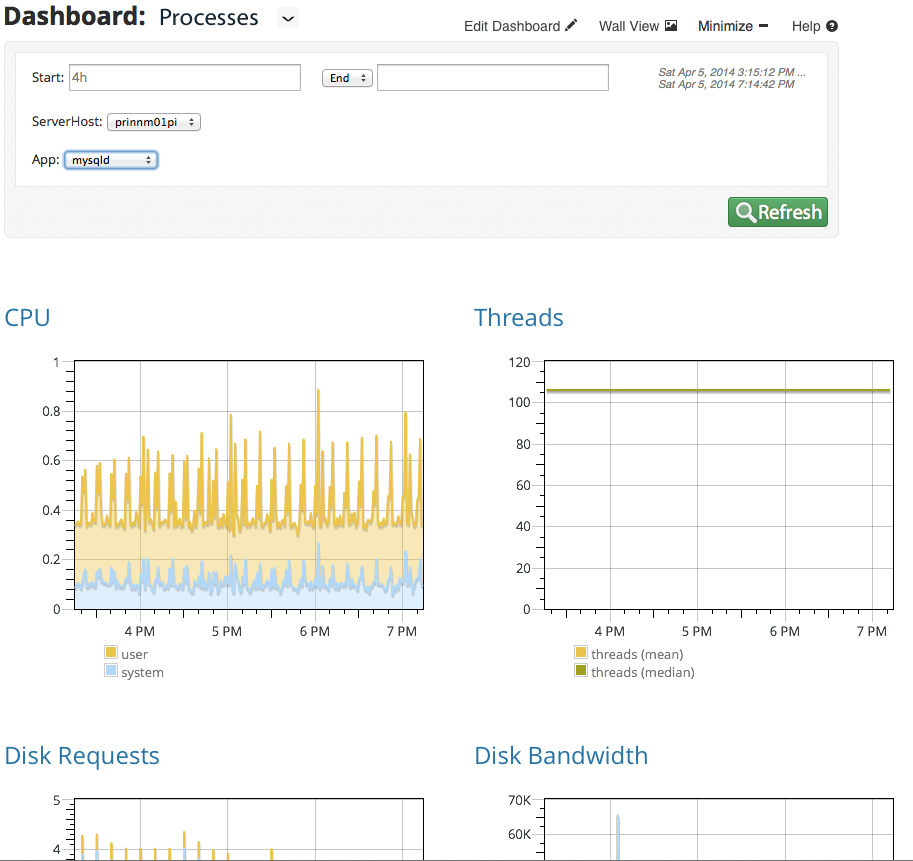
Processes Dashboard
Overall Impressions
I like the feel of the product, and the people behind it seem to be very switched on. A few queries I had were handled quickly, and it’s good to see that they have a quick turnaround time for rolling out new features.
It’s primarily going to suit the Web 2.0 crowd, as Enterprises like longer retention periods - but that is negotiable. I’d like to see some options around rolling up older data, so some summary data can be kept for longer periods to help with capacity planning.
Some other competing products focus only on log ingestion/parsing, but Scalyr recognises that logs are just one part of application monitoring. You need to integrate things like system metrics, data from external sources, and you need to be able to perform external service testing (logs alone don’t give you that).
Overall I think it’s a good product, and it works well for what it’s intended to do. If you’re looking for a low hassle way of pulling together your logs and monitoring data, I recommend trying it out.