Monitoring IPv6 vs IPv4 Traffic on Juniper SRX
I use a Juniper SRX 110 at home, and my ISP is enlightened enough to offer IPv6 by default to all customers. My devices are dual-stack, and I know that a lot of content is now available via IPv6 and IPv4. I’ve been trying to figure out how to measure the volume of IPv6 traffic, and I think I’ve got it figured out.
Initial attempt - JUNIPER-IPv6-MIB
I spent some time going through the Junos MIBS, and thought I’d found what I needed in the IPv6 Global Stats MIB. It seemed to return some data, but closer analysis showed that it was only showing me statistics for traffic to/from the SRX itself - e.g. Neighbor Discovery/Advertisement, ICMPv6 to/from the SRX, etc. It wasn’t showing me statistics for forwarded traffic.
Try Again - Policy Statistics
A bit more hunting around and I found the Policy Objects MIB. The online documentation doesn’t seem to include all updates, but it now has a jnxJsPolicySystemStats container that includes a sub entry jnxJsPolicySystemStatsIPv6, and gives stats on allowed and dropped IPv4 and IPv6 traffic. This sounds like me. Let’s try it out:
1
2
3
4
5
6
7
8
9
10
11
12
13
14
15
16
17
18
19
20
21
22
23
[lhill@nms ~]$ snmpwalk -M +/tmp/junipermibs -m ALL -v 2c -c SecretString 192.0.2.1 .1.3.6.1.4.1.2636.3.39.1.4.1.3
JUNIPER-JS-POLICY-MIB::jnxJsPolicySystemStatsTotalAllowIPv4Packets.0 = Counter64: 0
JUNIPER-JS-POLICY-MIB::jnxJsPolicySystemStatsTotalAllowIPv4Bytes.0 = Counter64: 0
JUNIPER-JS-POLICY-MIB::jnxJsPolicySystemStatsTotalAllowIPv4PacketsRate.0 = Gauge32: 0
JUNIPER-JS-POLICY-MIB::jnxJsPolicySystemStatsTotalAllowIPv4BytesRate.0 = Gauge32: 0
JUNIPER-JS-POLICY-MIB::jnxJsPolicySystemStatsTotalDropIPv4Packets.0 = Counter64: 0
JUNIPER-JS-POLICY-MIB::jnxJsPolicySystemStatsTotalDropIPv4Bytes.0 = Counter64: 0
JUNIPER-JS-POLICY-MIB::jnxJsPolicySystemStatsTotalDropIPv4PacketsRate.0 = Gauge32: 0
JUNIPER-JS-POLICY-MIB::jnxJsPolicySystemStatsTotalDropIPv4BytesRate.0 = Gauge32: 0
JUNIPER-JS-POLICY-MIB::jnxJsPolicySystemStatsTotalAllowIPv4Flows.0 = Counter64: 0
JUNIPER-JS-POLICY-MIB::jnxJsPolicySystemStatsTotalAllowIPv4FlowsRate.0 = Gauge32: 0
JUNIPER-JS-POLICY-MIB::jnxJsPolicySystemStatsTotalAllowIPv6Packets.0 = Counter64: 0
JUNIPER-JS-POLICY-MIB::jnxJsPolicySystemStatsTotalAllowIPv6Bytes.0 = Counter64: 0
JUNIPER-JS-POLICY-MIB::jnxJsPolicySystemStatsTotalAllowIPv6PacketsRate.0 = Gauge32: 0
JUNIPER-JS-POLICY-MIB::jnxJsPolicySystemStatsTotalAllowIPv6BytesRate.0 = Gauge32: 0
JUNIPER-JS-POLICY-MIB::jnxJsPolicySystemStatsTotalDropIPv6Packets.0 = Counter64: 0
JUNIPER-JS-POLICY-MIB::jnxJsPolicySystemStatsTotalDropIPv6Bytes.0 = Counter64: 0
JUNIPER-JS-POLICY-MIB::jnxJsPolicySystemStatsTotalDropIPv6PacketsRate.0 = Gauge32: 0
JUNIPER-JS-POLICY-MIB::jnxJsPolicySystemStatsTotalDropIPv6BytesRate.0 = Gauge32: 0
JUNIPER-JS-POLICY-MIB::jnxJsPolicySystemStatsTotalAllowIPv6Flows.0 = Counter64: 0
JUNIPER-JS-POLICY-MIB::jnxJsPolicySystemStatsTotalAllowIPv6FlowsRate.0 = Gauge32: 0
JUNIPER-JS-POLICY-MIB::jnxJsPolicySystemStatsEnabled.0 = INTEGER: disabled(2)
[lhill@nms ~]$
They’re all zero :(. Note that last item there - jnxJsPolicySystemStatsEnabled is set to disabled.
Aha! Enable Policy Statistics
The key to making it work is enabling systemwide statistics collection. This command was introduced in 12.1X46-D10, and is disabled by default. That’s a pretty new code branch, but you’ll be running that anyway if you’re trying to use IPv6. I’m running 12.1X46-D15.3, and it seems OK for my purposes (basic home setup with dual-stack, nothing too fancy).
The configuration looks like this:
1
2
root@srx01> show configuration security policies policy-stats | display set
set security policies policy-stats system-wide enable
Enable that, and you’ll start seeing some statistics come through:
1
2
3
4
5
6
7
8
9
10
11
12
13
14
15
16
17
18
19
20
21
22
23
[lhill@nms ~]$ snmpwalk -M +/tmp/junipermibs -m ALL -v 2c -c SecretString 192.0.2.1 .1.3.6.1.4.1.2636.3.39.1.4.1.3
JUNIPER-JS-POLICY-MIB::jnxJsPolicySystemStatsTotalAllowIPv4Packets.0 = Counter64: 571220
JUNIPER-JS-POLICY-MIB::jnxJsPolicySystemStatsTotalAllowIPv4Bytes.0 = Counter64: 314942594
JUNIPER-JS-POLICY-MIB::jnxJsPolicySystemStatsTotalAllowIPv4PacketsRate.0 = Gauge32: 12
JUNIPER-JS-POLICY-MIB::jnxJsPolicySystemStatsTotalAllowIPv4BytesRate.0 = Gauge32: 1098
JUNIPER-JS-POLICY-MIB::jnxJsPolicySystemStatsTotalDropIPv4Packets.0 = Counter64: 0
JUNIPER-JS-POLICY-MIB::jnxJsPolicySystemStatsTotalDropIPv4Bytes.0 = Counter64: 0
JUNIPER-JS-POLICY-MIB::jnxJsPolicySystemStatsTotalDropIPv4PacketsRate.0 = Gauge32: 0
JUNIPER-JS-POLICY-MIB::jnxJsPolicySystemStatsTotalDropIPv4BytesRate.0 = Gauge32: 0
JUNIPER-JS-POLICY-MIB::jnxJsPolicySystemStatsTotalAllowIPv4Flows.0 = Counter64: 24635
JUNIPER-JS-POLICY-MIB::jnxJsPolicySystemStatsTotalAllowIPv4FlowsRate.0 = Gauge32: 0
JUNIPER-JS-POLICY-MIB::jnxJsPolicySystemStatsTotalAllowIPv6Packets.0 = Counter64: 154703
JUNIPER-JS-POLICY-MIB::jnxJsPolicySystemStatsTotalAllowIPv6Bytes.0 = Counter64: 113836855
JUNIPER-JS-POLICY-MIB::jnxJsPolicySystemStatsTotalAllowIPv6PacketsRate.0 = Gauge32: 0
JUNIPER-JS-POLICY-MIB::jnxJsPolicySystemStatsTotalAllowIPv6BytesRate.0 = Gauge32: 0
JUNIPER-JS-POLICY-MIB::jnxJsPolicySystemStatsTotalDropIPv6Packets.0 = Counter64: 0
JUNIPER-JS-POLICY-MIB::jnxJsPolicySystemStatsTotalDropIPv6Bytes.0 = Counter64: 0
JUNIPER-JS-POLICY-MIB::jnxJsPolicySystemStatsTotalDropIPv6PacketsRate.0 = Gauge32: 0
JUNIPER-JS-POLICY-MIB::jnxJsPolicySystemStatsTotalDropIPv6BytesRate.0 = Gauge32: 0
JUNIPER-JS-POLICY-MIB::jnxJsPolicySystemStatsTotalAllowIPv6Flows.0 = Counter64: 1235
JUNIPER-JS-POLICY-MIB::jnxJsPolicySystemStatsTotalAllowIPv6FlowsRate.0 = Gauge32: 0
JUNIPER-JS-POLICY-MIB::jnxJsPolicySystemStatsEnabled.0 = INTEGER: enabled(1)
[lhill@nms ~]$
Pulling it All Together
I created a new Dynamic Application in ScienceLogic to poll the OIDs I was interested in:
- jnxJsPolicySystemStatsTotalAllowIPv4Packets - 1.3.6.1.4.1.2636.3.39.1.4.1.3.1.1
- jnxJsPolicySystemStatsTotalAllowIPv4Bytes - 1.3.6.1.4.1.2636.3.39.1.4.1.3.1.2
- jnxJsPolicySystemStatsTotalAllowIPv6Packets - 1.3.6.1.4.1.2636.3.39.1.4.1.3.2.1
- jnxJsPolicySystemStatsTotalAllowIPv6Bytes - 1.3.6.1.4.1.2636.3.39.1.4.1.3.2.2
I won’t go into the ScienceLogic setup here, but it was pretty straightforward - find the OIDs in the OID Browser, add to a new Performance Application, make some of the names more readable, and then assign the new app to my SRX.
After a few hours, I had some nice data coming through - here’s a couple of graphs, top one showing IPv4 & IPv6 packets, and bottom one IPv4 and IPv6 bytes. Note the spike around 8:30 in IPv6 traffic - I believe that was some YouTube traffic.
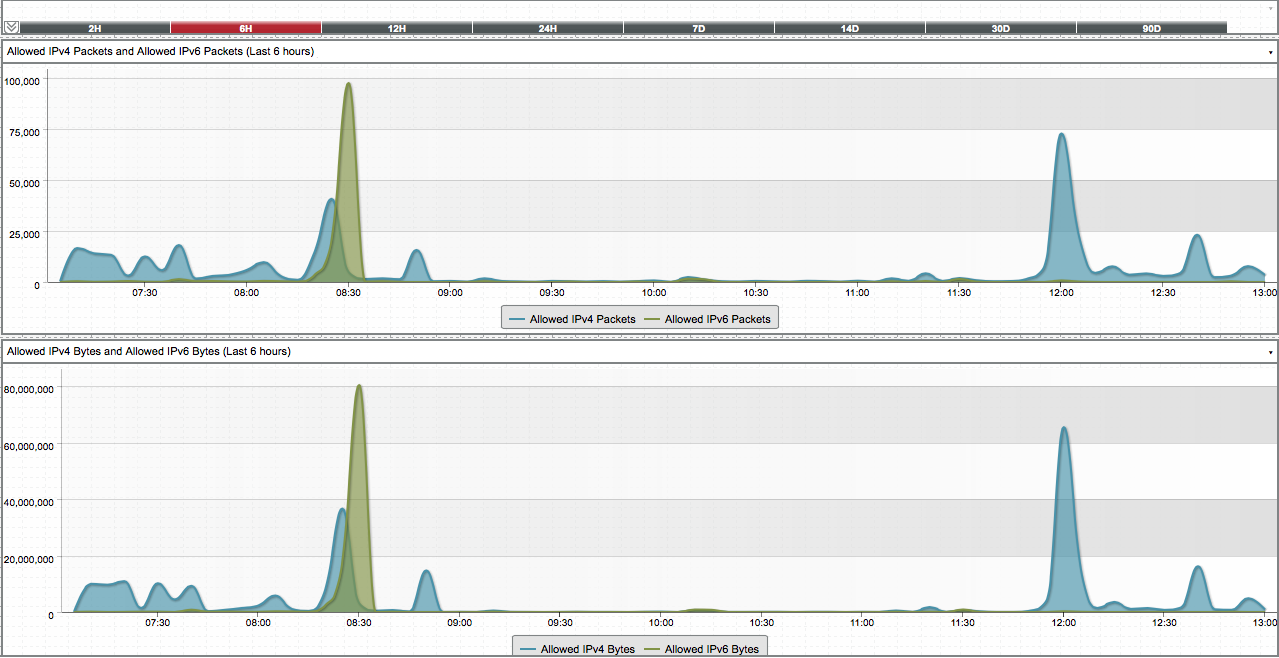
IPv4 and IPv6 traffic
Haters gonna hate on IPv6, but I don’t care - there’s a significant chunk of my Internet traffic going via IPv6, and that makes me very happy. I’ll keep an eye on it over the next few months to see how it changes. The overall pattern should be a bit clearer once I’ve got a few weeks’ worth of data.