IXP Graphs are an Eyesore
Too many IXPs (and networkers in general) are using horrible outdated methods of graphing data. These are an ugly eyesore, and should be updated to something from this century. Big IXPs in particular have no excuse: they have the resources to do better.
IXPs: Invest, Spend, Drop Prices?
Two years ago Dave Temkin from Netflix presented at NANOG 67, talking about The Real Cost of Public IXPs (warning: PDF).
This caused a bit of a stir. As El Reg put it:
[According to Dave Temkin] The internet exchange industry is ripping customers off, charging too much for features people don’t need, and spending millions on staff salaries, unnecessary marketing and social events.
You can argue amongst yourselves as to how much IXPs should invest, how closely their port prices should track transit costs, etc. Or maybe you just like all the free drinks, dammit.
I think that if they’re going to spend money rather than reduce prices, they should spend it on something I care about: Data visualization. Most IXPs traffic graphs are an eyesore, they’re outdated, and it’s time they were fixed.
Ugly Eyesores
Here’s some typical traffic graphs from some of the biggest IXPs in the world:

DE-CIX
AMS-IX
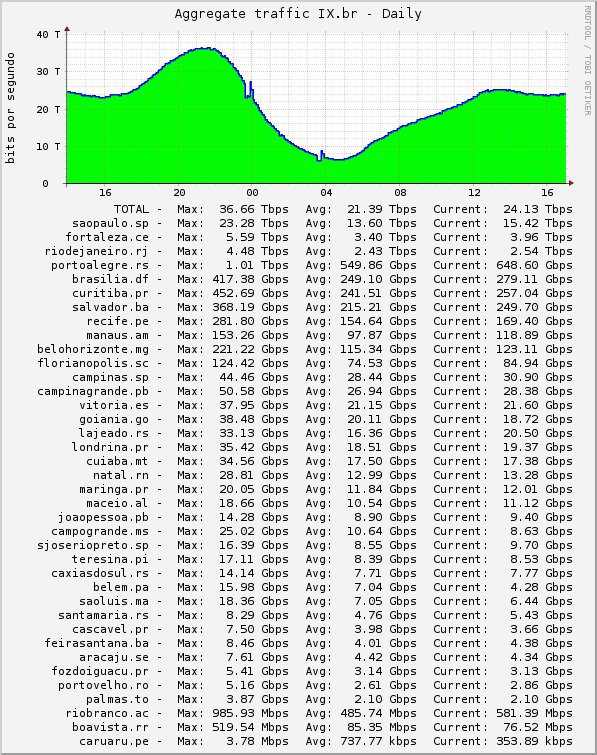
IX.br
All ugly. All awful. All generated using 20yr old rrdtool or some derivative.
OK, It’s Not All Bad
Some IXPs are doing a good job. Check out these examples - note you’ll need to click the image to go to a full interactive display:
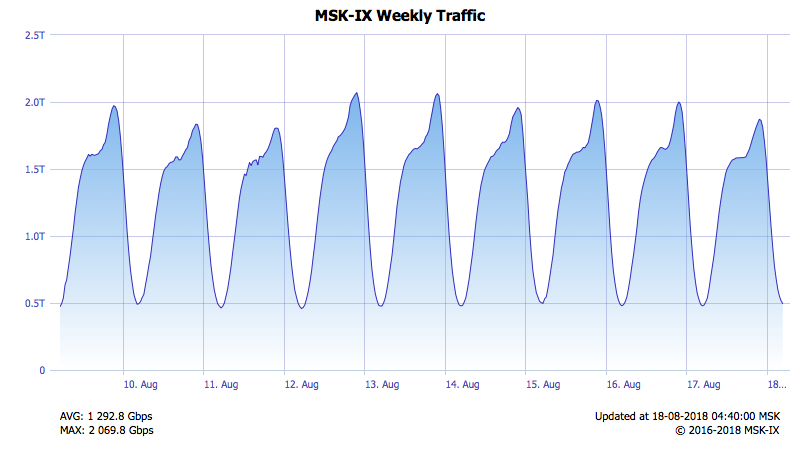
MSK-IX (Using Highcharts)
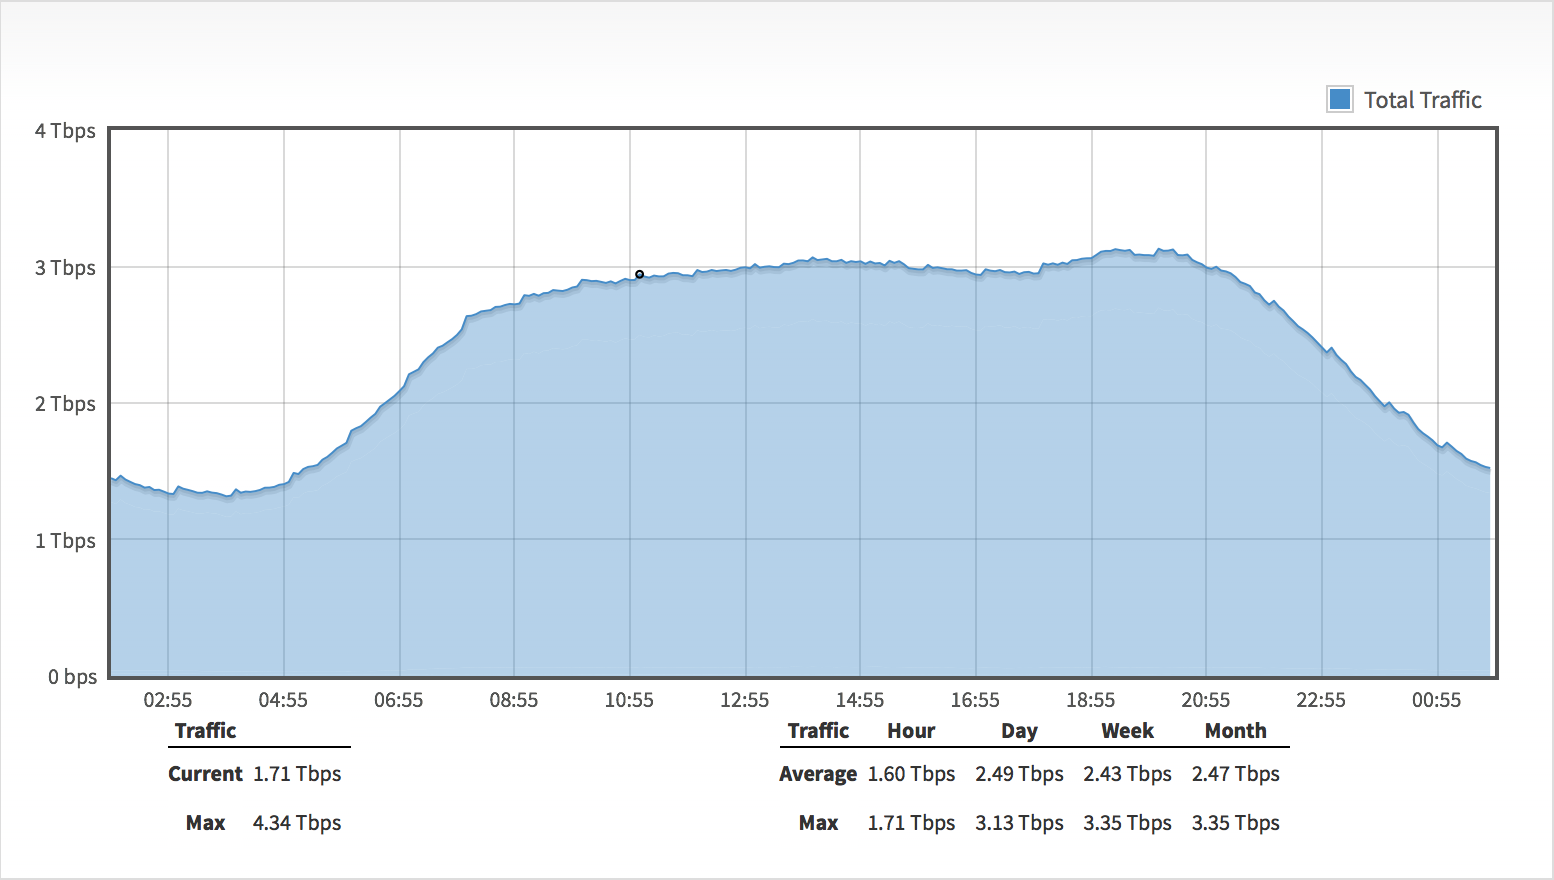
LINX (Using Chart.js)
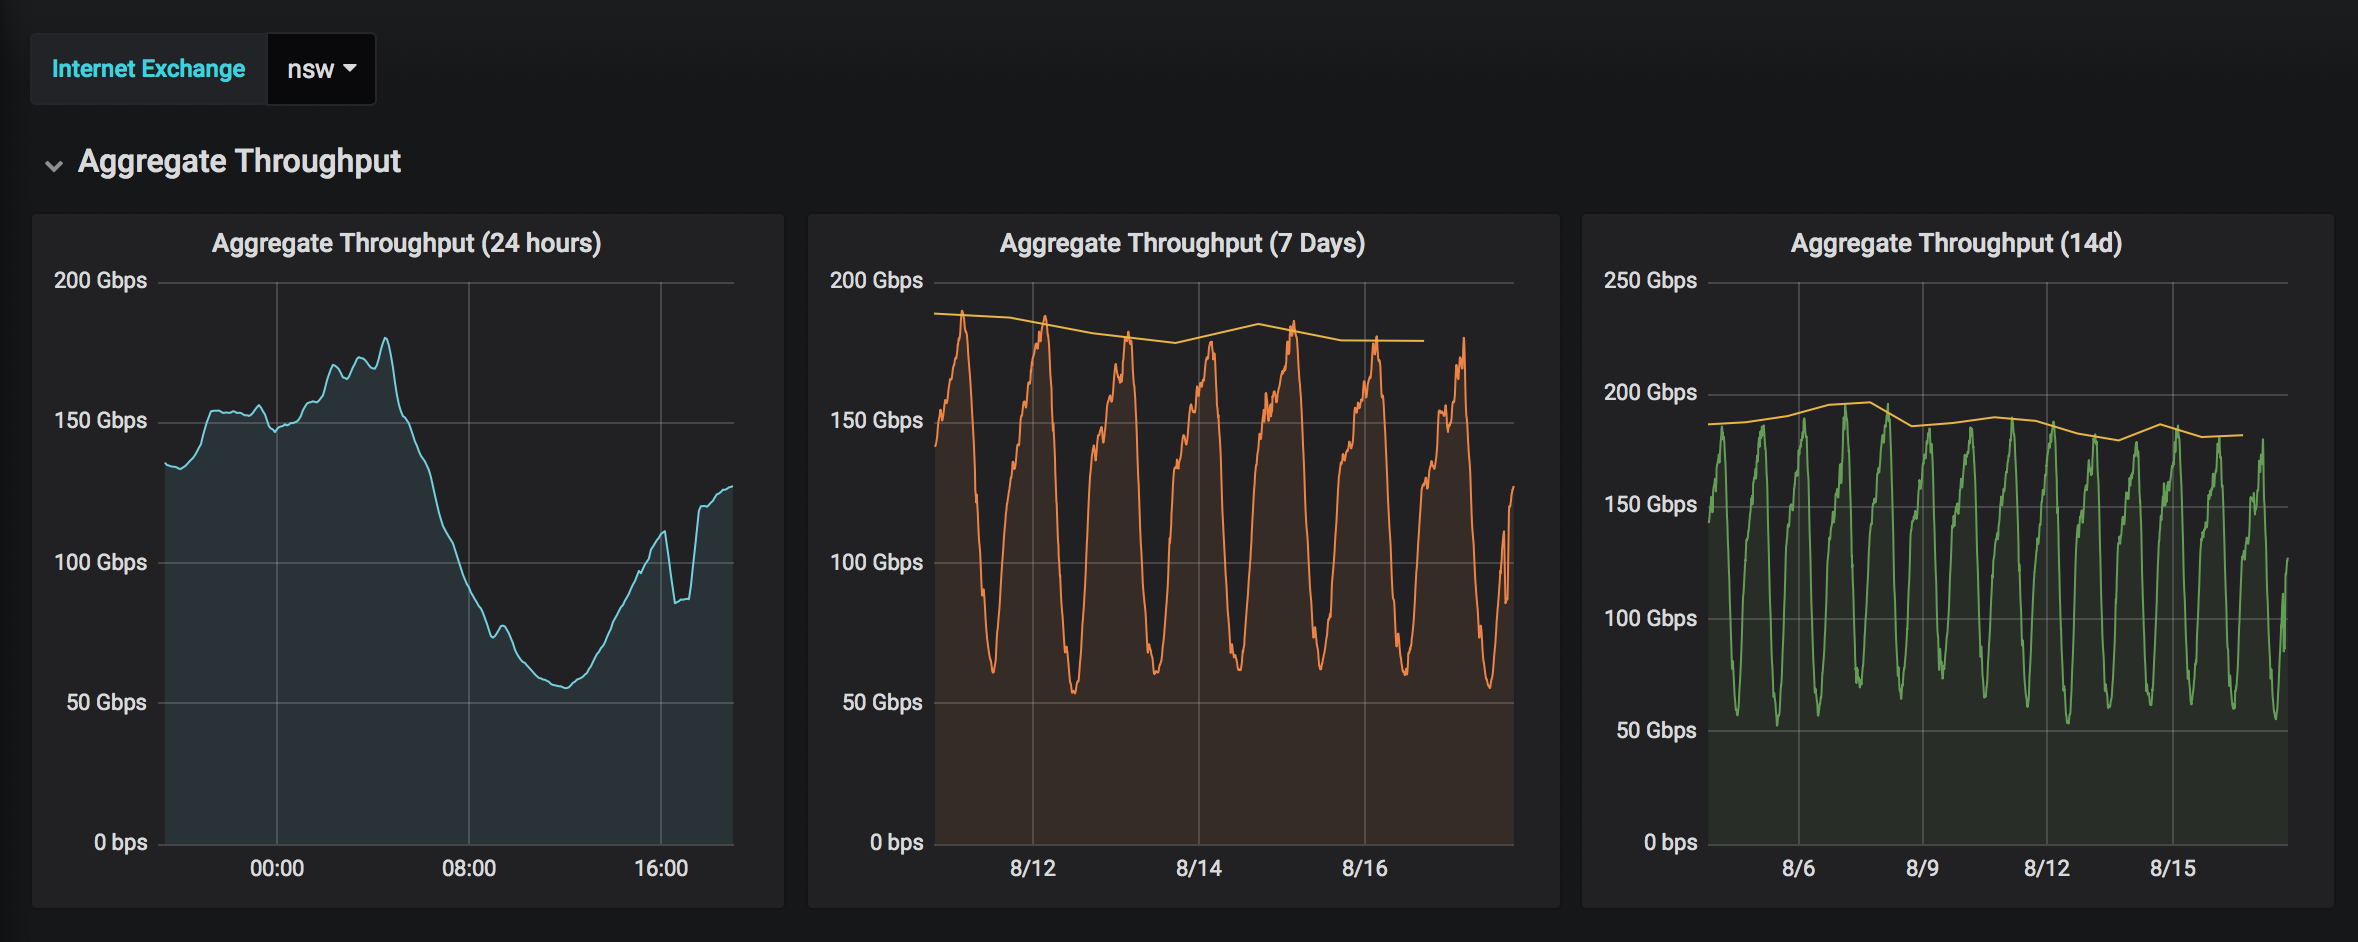
IX-Australia (Using Grafana)
These graphs are much more pleasing to the eye, and are interactive. Users can easily zoom in or out, add details, etc. So much nicer.
Time to Update
rrdtool is old and ugly. It was fine 20 years ago, when that was all we had. But the world has moved on, and there are many good Free, Open Source options for visualizing time-series data.
Maybe IXPs could go to one less conference this year, and fund an intern to fix up their data? Give us beautiful graphs, and publish the data in a format we can consume it ourselves if we wish.